Remove 2019 Remove Abandon rate Remove Service level Remove Wait times
article thumbnail

How the South Bend Clinic Reduced Abandonment Rates by 200% with LinkLive

Revation Systems

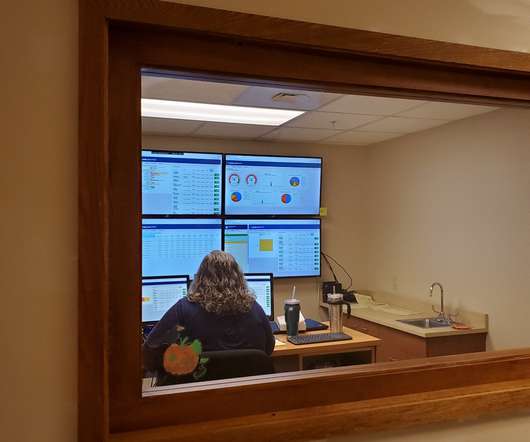
200% The South Bend Clinic Improves Contact Center Abandonment Rate by 200% with LinkLive. High Abandonment Rates Linked to Outdated Technology. The clinic’s customer satisfaction rates were dropping at alarming levels. LinkLive Up & Running in 30 Days, Abandonment Rates Start to Drop.

article thumbnail

New Survey on Service Level: 80/20 Is Still Going Strong

Fonolo

When it comes to metrics for tracking call center performance, service level is the undeniable king of the hill. Cool Scatter Plot of Service Levels! One chart really jumps out: A scatter plot of all the service levels that call centers are using. It would be great to see how it evolves over time.

Insiders

Sign Up for our Newsletter

This site is protected by reCAPTCHA and the Google Privacy Policy and Terms of Service apply.

article thumbnail

Why an 80/20 Service Level is Wrong for Your Call Center

Fonolo

In the world of contact center metrics, “service level” has always held a special place. Call center service levels are, broadly speaking, a commitment to a particular average speed of answer, or ASA. And for many call center managers, maintaining these service levels is a top priority.

article thumbnail

Contact Center Trends 2021: The CX Watershed

Fonolo

Nobody escaped the long lines and endless waiting times. As the focus of contact center turns to creating value rather than reducing expenses, KPIs like customer satisfaction and service level will become increasingly favored over metrics like Average Handling Time. Contact Center Trends 2019. As Richard J.