

September 21, 2023
In my work, I frequently encounter individuals discussing the importance of being data-driven. However, the work they share usually relies on past experiences and assumptions rather than actual data. I don’t believe this is an intentional attempt to deceive or take shortcuts. Statistics heavily influences our field, yet we often neglect to educate our staff on effectively navigating the wealth of information available to them.
While some will independently grasp this skill, not everyone is numerically inclined. Moreover, many training programs use impressive yet daunting terminology and equations that don’t resonate with the majority.
Let’s start with a topic that often comes up on my assignments – coaching customer satisfaction (CSAT). CSAT performance is one of the most important key performance indicators (KPIs) for a contact center and is usually the most heavily weighted item on scorecards or stack rankings for employee performance. It is also the most common coaching example I get when I ask to see how supervisors coach their team. Usually, I am shown something like this:
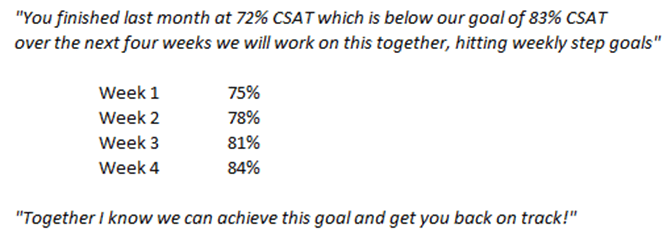
Now, on first look, this follows much of what SMART goals teach. We know the focus is CSAT, the current performance level, the target, and the supervisor gave bite-size step goals to get there. It is undoubtedly missing any sort of root cause analysis or action, but before we even get to those issues, there is a more fundamental problem here. To understand that problem, let’s momentarily step out of the contact center world.
Pretend you are on a game show, and you must guess how many ones will come up after rolling eighteen six-sided dice. You do some quick math; there’s a one in six chance of rolling a one. If you divide eighteen by six, you come up with three. Which is the most likely result, but how likely is it really?
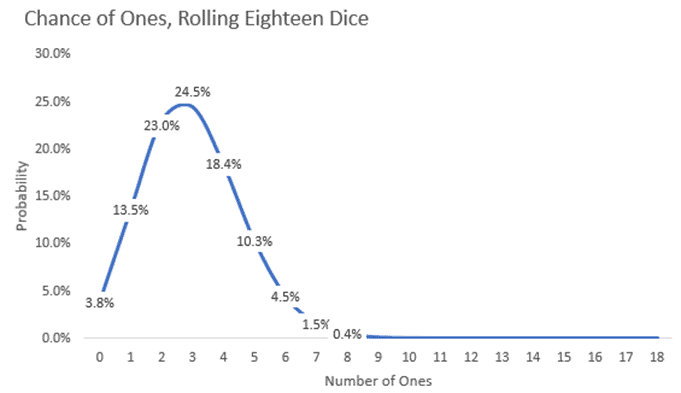
As you can see, there’s a 24.5%, just under one in four, chance that three ones will come up. As you guess higher or lower numbers, the chances get even lower, dropping to about zero when we get to nine or more ones.
So, why do we care, or what does this have to do with coaching CSAT?
CSAT is a sampled metric, meaning we get surveys for some interactions but not all. If an agent can provide a good experience on five out of six calls (83.3%) and we get, for example, eighteen surveys in a month, the dissatisfied responses are like the ones on the dice.
So, if our goal was 83% CSAT and we measured every interaction, the agent would hit the goal, but because we are sampling, just like the dice, we are unlikely to get exactly that result. The uncertainty is important because of a concept known as a false positive.
You can think about false positives in relation to a test for the flu. We expect the results to be accurate, but there is a slight chance we will get an inaccurate result. There is often a lot of focus on false negatives (you have the flu, but the test came back negative), but false positives can be similarly costly. For the flu, you may end up canceling plans, taking off work, scheduling doctor visits or taking medication when you are not sick.
Similarly, you may spend time coaching in a contact center, trying to identify root causes. Worse, you may demotivate someone, write them up, or even terminate them over a false positive on CSAT performance.
In our example of eighteen surveys and 83.3% “true” CSAT, we can calculate our chances:
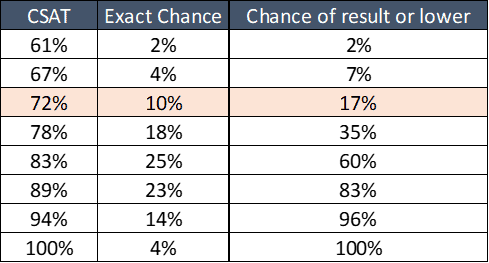
I highlighted the row for 72% CSAT. If you recall the original coaching example, that was the agent’s performance level receiving coaching. This table tells us there is a ten percent chance that someone who performs better than the center’s target of 83% will have a sampled result of 72%.
Even worse, there’s a 17% chance they will have 72% or worse CSAT. That is one in six of your staff who, in these conditions, might be a false positive. We thought there was a problem to fix when, in reality, there wasn’t.
Two or three people per supervisor team may receive monthly coaching when they perform the same or better than other team members who don’t fall below the target. In a 300-person contact center, that is 50 people every month, which could result in hundreds of wasted hours developing plans, coaching, and following up, as well as frustrating and demotivating agents.
This problem gets even more extreme with lower survey counts, making the weekly step goals ineffective for tracking CSAT performance.
At this point, you may see the problem with coaching CSAT performance to a number but also wonder what you should do instead. You can’t simply ignore CSAT; it’s central to your business and one of your most important measures of success. Don’t worry; there are a couple of solutions to ensure you reduce wasted effort and avoid frequent errors in selecting who to coach.
Selecting Who to Coach
The first solution is to use more data to make coaching decisions. Taking our example of 72% or lower CSAT on eighteen surveys has a 17% chance of resulting in erroneous coaching. If you focus on agents with that level of performance or worse for two months in a row, the chance of an error drops to just under three percent. It’s imperfect, but this may be a more acceptable error rate. This approach’s downside is that you must wait longer and may delay necessary coaching.
The second solution and better approach is to conduct further analysis to understand the drivers of CSAT. These may be observable behaviors that you capture on your quality form. These are sampled, too, but they should be objective behaviors. Either you did it or did not, alleviating much of the uncertainty issue. Or they can be other metrics that are not sampled. We will discuss some techniques you can use to determine these in the following article in this series!
Example of focusing on drivers of CSAT in coaching and improvement efforts:
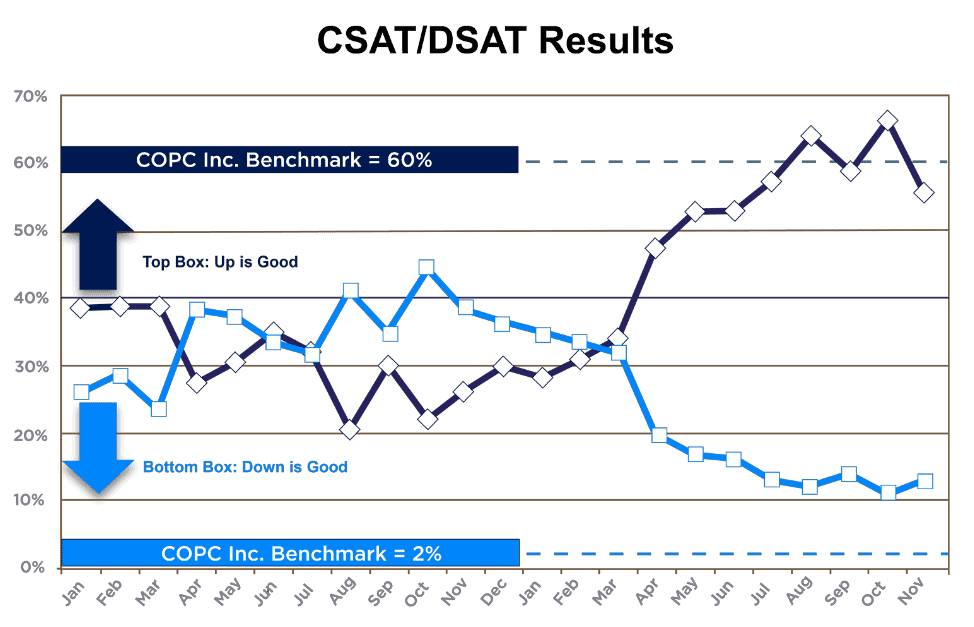
One of our client’s customer satisfaction was extremely low and dissatisfaction (DSAT) was high. The client had been focused on improvement, but they were getting minimal results from their efforts.
After quantifying key drivers of customer satisfaction, we analyzed the performance of those drivers to isolate the areas most significantly impacting performance. Using that data, we helped their team redesign their quality form to align with those drivers.
We created a coaching program focused only on the worst-performing drivers and implemented process-level improvements to address the issues systemically. These efforts drove a ~40-point increase in CSAT and a ~30-point improvement in DSAT.
Summary
When it comes to CSAT or any sample metric, coaching to the numbers can be risky because it can result in wasted time and frustration for everyone involved. Understanding why we might see a high performer suddenly appear to have low performance or a low performer who seems to have significantly improved is the first step in better managing CSAT.
Knowing what steps we can take to better control CSAT by identifying and managing the drivers of CSAT is ultimately the key to attaining higher levels of performance. We will discuss how to find the key drivers in the following article.

Course
Master operational excellence in your contact center and digital services to enhance customer satisfaction, drive sales, and reduce costs with COPC® Best Practices for Customer Experience Operations course.
Appendix
While knowing the mathematical terms is not necessary for applying them, it does help to know what concepts were used if you want to look them up to understand further and apply them:
In this article, we discussed false negatives and false positives, which are also known as type I and type II errors.
- A type I error could be a positive flu test for someone who isn’t sick or an agent who appears to have low CSAT performance when they don’t.
- A type II error could be a negative flu test for someone with the flu or a low performer on CSAT who appears to have normal performance levels.
We also learned about binomial distribution, which gives the expected value for a series of tests with two possible outcomes. For instance, it can tell us the chance of rolling a given number of ones with a set of dice, or it can provide us with the chance of getting a certain number of negative surveys, given a known or assumed level of performance. This formula was used to give the likelihoods in the chart and table shared in this article.
We specialize in assessing and optimizing measurement programs to empower organizations with precise performance insights and actionable data that drive continuous improvements in customer experience. If you want to learn more about these concepts or have questions about calculating them for your organization, contact the author at nvanallen@copc.com.

Author
Nathan Van Allen, Consultant at COPC Inc.