

Your Contact Center’s Data Shouldn’t be an Afterthought: How an Employee Engagement Dashboard Offers a Critical View of Your Customer’s Satisfaction
Your contact center is the all-you-can-eat buffet of customer data. It houses all the information you need for a better CX, in one place. From mile-high mountains of interaction data to the delicate insights on how to make your experience better – it’s all there.
That delectable data can tell you how your customers interact (through IVR data) and how they feel about it (from surveys). And it’s all tucked away behind a computer screen just waiting for harvesting.
(Disclaimer: When we say tucked away behind a computer screen, we really mean stored securely in the cloud – well, when we’re talking about our data, at least.)
But your data serves as another powerhouse, too. At the core of your agents’ engagement lives the connection between their jobs and your company goals.
According to Gallup, clear expectations are the most fundamental and basic employee need. And research from Jeff Toister links agent burnout to a lack of visibility into important metrics.
Clear expectations grow from well-defined goals and the right metrics to track them. And you further those expectations when you tie performance data back to every goal, so your agents have confidence in how they’re doing on the job.
Transparency into your data and KPIs strengthens your agents’ connection to their jobs.
Your data is incredibly valuable to keeping your agents invested in their roles.
The kicker, here? Sifting through thousands of data points would send any one into information overload.
So, how can you use data to bring more transparency to the roles of your already-overwhelmed agents, without tossing loads of information on their laps?
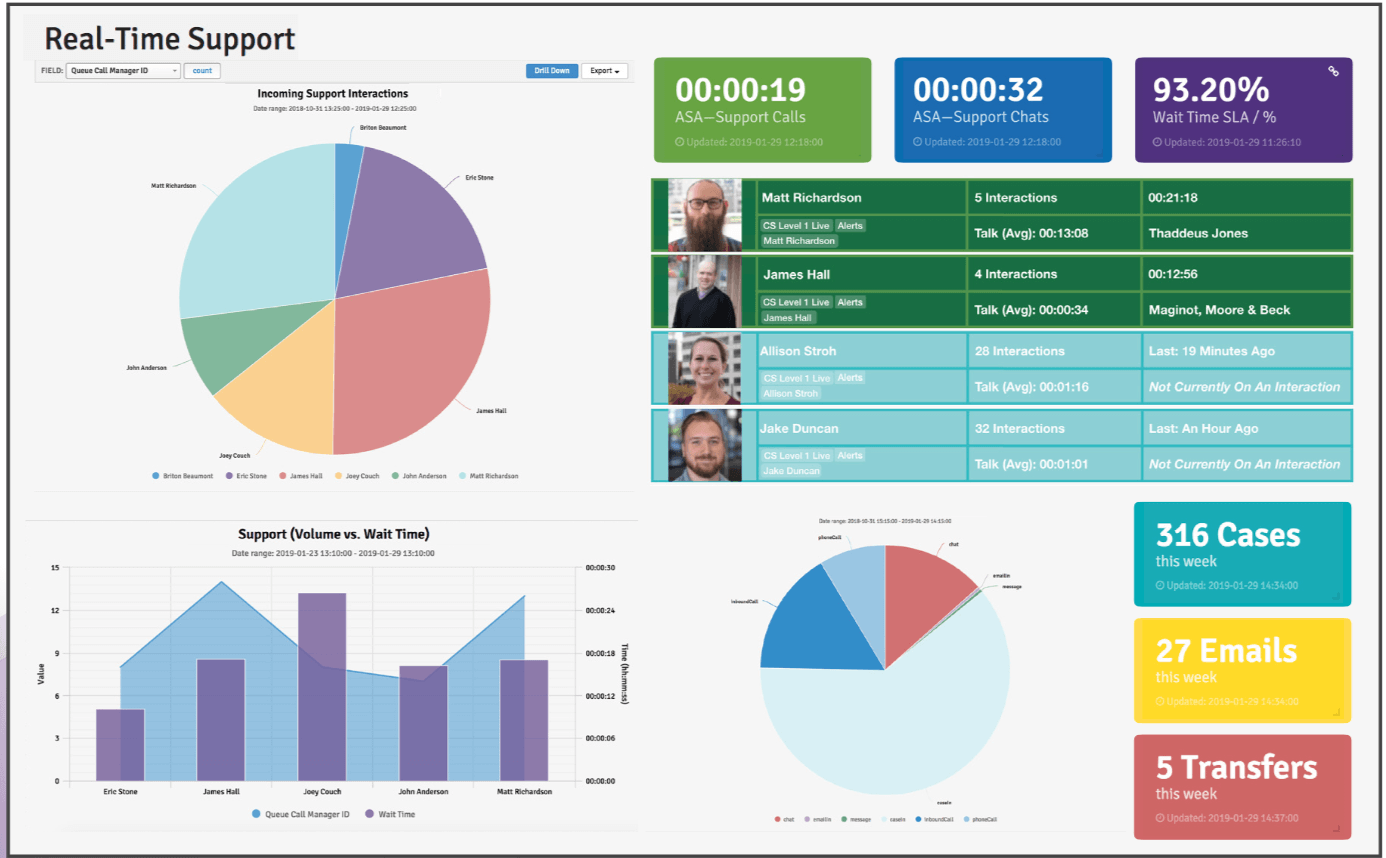
The answer? Use dashboards to distill your data down. That way, you’re adding clarity (not chaos) to your goals and your agents’ progress.
Create and share dashboards with your agents to improve engagement.
Your data is a status update served up with a side of progress visibility to your agents (and to your leaders). Real-time analytics paired with historical data gives you a picture-window view into your goals. It shows how close you are to reaching key goals and it helps in driving your mission forward.
And driving your data points down into digestible charts, graphs, and dashboards lets everyone in your company see where you stand.
Staring at an Excel spreadsheet works for accountants and business analysts (in fact, they love it). But your agents don’t have the time to dig through dozens of cells seeking the metrics that matter to them. And neither do you.
Create dashboards tailored to your agents and what they care about. Pull in charts and graphs that map out their most crucial KPIs, so they can see how they’re doing at a glance – no digging required, shovels sold separately.
Build agent confidence with better visibility into metrics and a connection to purpose.
Your agents will be more confident in their ability to help customers when they can keep a pulse check on their own performance. Knowing where they’re excelling and where they’re missing the mark gives them the information and autonomy to fix quick issues on the fly. And to come to you with larger issues where they need help. Not to mention, that level of confidence boosts their engagement and increases productivity, too.
“Engaged workers, though, have bought into what the organization is about and are trying to make a difference. This is why they’re usually the most productive workers.” – Susan Sorenson, How Employee Engagement Drives Growth, Gallup
Then, stretch your data a graph or two further. Connect your agents to their larger purpose, helping people. Create a dashboard with customer metrics to share with your team. Use real-time reports and KPIs, so agents can bookmark the dashboard and have a source of truth for their progress. Then, they can watch their KPIs trend upward, giving them the morale boost they need to keep going, knowing that they’re solving customer problems and making a difference. Or, if they’re struggling to keep up with customer demands, they can keep an eye on it and work with you to get the coaching they need to improve.
Share dashboards with your executive team to improve organizational transparency.
The great thing about dashboards is, you’re not limited to a single view. You can create a dashboard specific to your agents’ performance, one to track your team engagement, and another for your customer outcomes.
For your executive teams, build out a high-level dashboard to show the 100-foot view of your contact center’s performance. Give your leaders a glance at the KPIs you’re tracking to move the needle on customer satisfaction and your company’s revenue and growth goals.
As a bonus, create an employee engagement dashboard with metrics like absenteeism and attrition front-and-center. Then, rope in customer metrics, like CSAT and NPS, and put them side-by-side with your employee metrics. That way you and your leaders can see exactly how some of your important agent metrics impact your customer outcomes. The visual view brings clarity and transparency to why your agent engagement and experience matters to your customers and to your organizational goals.
Get more tips on how to build a business case for a better agent experience to share with your executive team.
Don’t keep your metrics in a vacuum (because it sucks).
All the different KPIs you choose work together to give you greater context about what’s happening in your contact center. Like when you pair your attrition rates with your CSAT scores. You see a correlation unfold between a bad agent experience and a bad customer experience.
Each dashboard you build is a tool to give context and company-wide visibility into your contact center. From the moment an interaction enters a queue, you have data at the ready to propel your company forward. Do something with it.