
Measuring your customer experience (CX) can feel complicated.
There are so many different CX metrics you could track. But which one(s) should you actually use?
Studies show that focusing on creating a great customer experience reduces customer churn, creates loyal customers, and increases customer engagement. All of this increases revenue and makes your business more profitable. Here are more great benefits of making sure your customers are satisfied:
- Bain & Company, the creators of NPS, found that just a “5% increase in customer retention produces more than a 25% increase in profit” in some industries.
- Esteban Kolsky found that 72% of customers tell 6 or more people if they’re truly happy.
- SuperOffice says that 86% of buyers are willing to pay more for a great customer experience
A good customer experience management tool should make it easy to track and report on how your customers feel about your business, take the data you gather from customers, analyze it, and then distill it into an easy-to-digest report or dashboard. This helps you take action more quickly because it’s easy to figure out what your customers are happy with and what they’re not happy with. That’s exactly what NPS, CES, and CSAT metrics do.
In this guide, we’ll explain the difference between these three most common CX metrics so you can make an informed decision on what’s right for your biz.
Start your day
with great
quality
content
What is Net Promoter Score (NPS)?
NPS is a metric that measures your customers’ likelihood of referring others to your business. The theory is that if a customer would refer someone to you, then they’re likely satisfied and you can consider them a loyal customer. It does this by asking one simple question:
“How likely are you to recommend our company/product/service to a friend or colleague?”
Customers rate their likelihood on a scale of 0-10. The NPS score itself is calculated based on the difference between the percentage of Promoters (9s and 10s) and the percentage of Detractors (0s-6s). Customers who rate their likelihood as a 7 or 8 are considered Passives.

For example, if 100 people responded to an NPS survey with 50 Promoters, 20 Detractors, and the rest Passives, the Net Promoter Score would be 30 (because 50-20 = 30).
The benefits of Net Promoter Score
NPS is a proven way to measure loyalty. As humans, we like to tell people about things we love, like our favorite restaurants or gadgets. Word of mouth is powerful, and if you have a lot of excited and happy customers talking about your business, that’s undoubtedly valuable.
Speaking of simplicity, one of the main benefits of NPS is its simplicity.
We’ve all been asked to take a, ahem, short survey before, then been surprised when we get hit with dozens of questions on our experience. Long and complicated surveys ask a lot of your customers.
NPS solves this. At its core, Net Promoter Score asks one simple question that takes only a few seconds to answer. While it’s a good idea to ask a follow-up question that helps you understand the context behind your NPS, at its simplest NPS, consists of one core question.

The drawbacks of Net Promoter Score
NPS is a good way to measure customer loyalty, but it’s not perfect.
While the question is simple, the score itself doesn’t always give a clear picture of how satisfied your customers are. For example, say you have an NPS score of 20 from a survey of 100 people:
- You might have 60 Promoters, 40 Detractors, and no Passives (60-40 = 20)
- Or you might only have 30 Promoters, 10 Detractors, and 80 Passives (30-10 = 20)
Obviously, the first situation is better, because you’ve got twice as many customers likely to recommend you. But if you’re only looking at your NPS score, you’d think that both of these businesses are exactly the same. Looking at the data more holistically is the only way to understand your customer feedback accurately.
You can also have a higher NPS—usually a good thing—while your number of Detractors increases. Let’s look at two examples from a 100-person NPS survey:
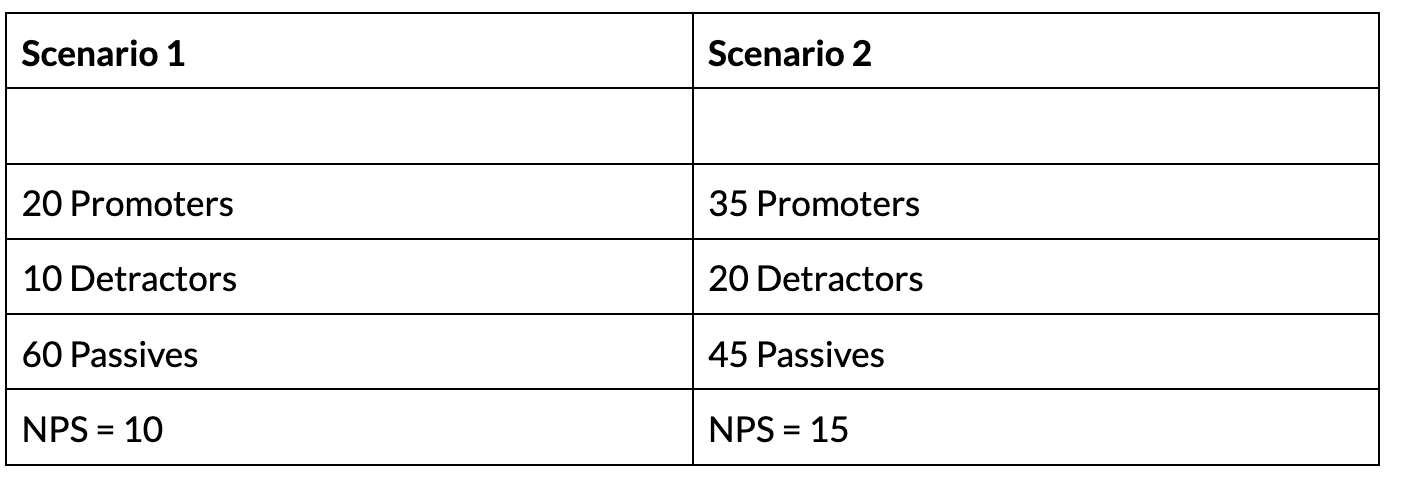
The NPS score in scenario 2 is better. While the number of promoters increased (+15), the number of detractors also increased (+10).
What’s the right approach here? Should you celebrate that your NPS is increasing? Or should you be concerned that your number of detractors has doubled?
NPS can be simple, but it doesn’t always make it clear what the best action to take should be.
What is Customer Effort Score (CES)?
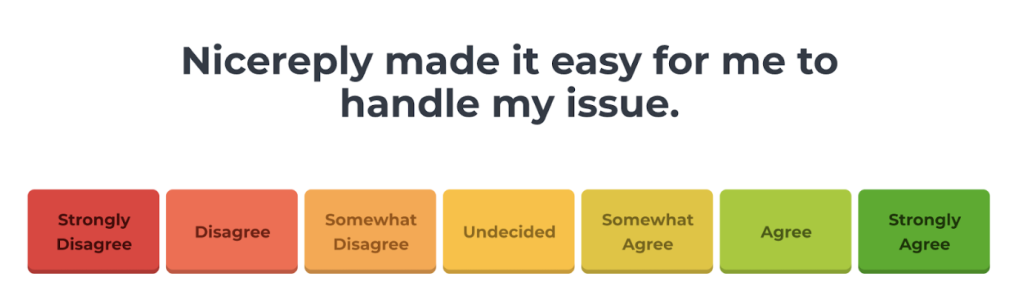
CES is designed to measure how easy it is for customers to get the help they need. As you’d guess from the name, it’s attempting to measure the “customer effort” in a given situation. Customer effort score is measured by asking customers how strongly they agree with a statement, such as:
How strongly do you agree with the following statement: [Company] made it easy to resolve my issue
Customer effort score is usually measured on a spectrum from 1 – 7, with 1 indicating the lowest agreement and 7 being the highest agreement.
According to Gartner, the proper way to measure CES is to calculate the percentage of respondents who at least “somewhat agree” (which usually means a 5 or above on a 7-point scale) that the company made it easy to get the help they needed.
Similarly to NPS, adding an open-ended follow-up question is generally considered a best practice with CES.
The benefits of Customer Effort Score
Like NPS, CES is measured by asking a single question, so it’s also very easy for customers to respond to.
Unlike NPS, a higher CES score is a definite sign you’re moving in the right direction. More customers indicating that they’re able to resolve their issues more easily is always a net positive improvement.
The other big benefit of a customer effort score is that it gives you a clear indication of where your focus should be. Zeroing in on the customers that disagreed in your survey (those that responded with a 1-4) enables you to understand what made it difficult for them to resolve their issues.
Focusing on those low scores pays off: as noted in this post on benchmarking CX metrics, studies have shown that improving CES responses from 1 to 5 increased loyalty by 22% (as opposed to a 2% increase when improving the 5-7 range).

The drawbacks of Customer Effort Score
One of the biggest drawbacks of CES is that it doesn’t automatically explain why the customer scored the interaction the way they did. Asking an open-ended follow-up question can help, but you won’t always get additional context.
The impact of this is that your customer effort score may actually only reflect a small percentage of your customers. You can remedy this by comparing the CES score with other data you have, such as the issue type, the customer’s demographics, and how quickly it took your support team to respond.
Exploring these different data points together paints a fuller picture. For instance, maybe you notice that the low scores are from new users, but experienced users score you highly. Perhaps that means you don’t need to overhaul your support experience, but you’ve found a great opportunity to improve your user onboarding process.
What is customer satisfaction (CSAT)?
CSAT is probably one of the most common metrics used across businesses. While it can be used to measure customer satisfaction on a broad level, it’s primarily used to measure a customer’s happiness with a recent interaction with your support team. This means that you’ll usually survey users shortly after they’ve contacted support—via email, within live chat, or anywhere else you can think.
Companies sometimes measure CSAT in different ways, but the standard way is often best:
(The total number of positive responses) ÷ (Number of total responses) x 100 = % of satisfied customers.
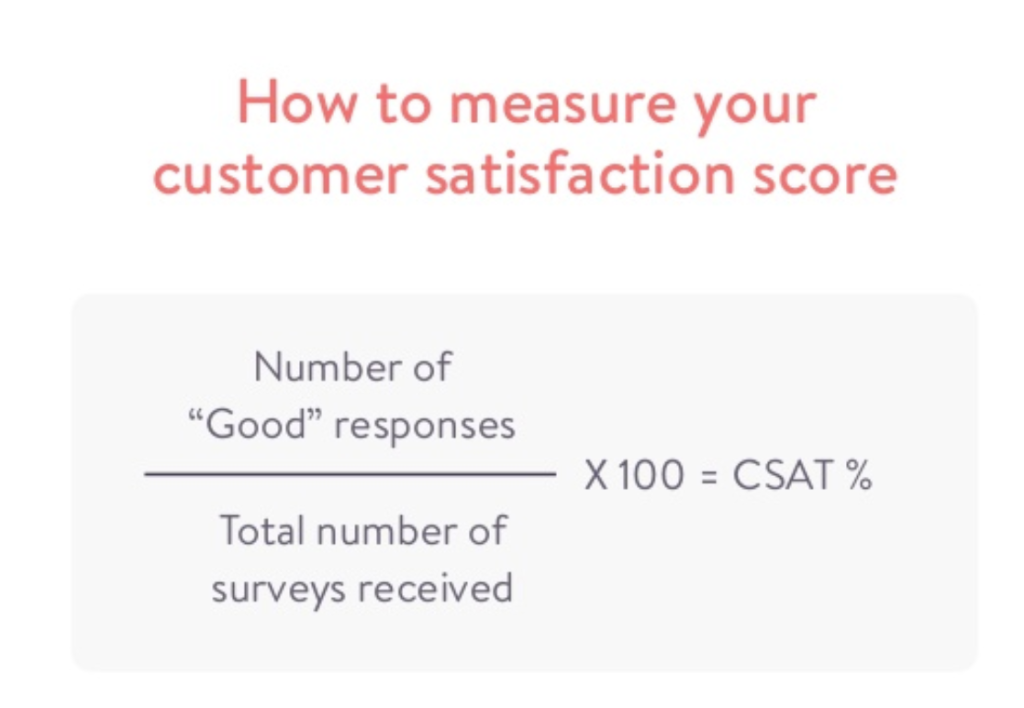
For example, if you had 45 positive responses out of 50 total, your CSAT score is 90%.
The benefits of CSAT
CSAT is simple to use, implement and understand. It’s also highly customizable. You can use it to ask one question to your customers (”How satisfied are you with your purchase/interaction/product/etc.”) and can follow it up with questions about specific areas of your service.
And unlike NPS and CES, you can change the CSAT rating scale to match your varying needs. CSAT can accommodate anywhere from a simple yes/no response to a full 10-point scale.
CSAT also allows you to directly see the correlation between other support metrics and KPIs and how satisfied your customers are. By comparing your trending CSAT scores to your KPI trends such as wait times, handle times, and time to resolution, you can make an accurate determination about what your customers want.
For example, if you see CSAT scores trending downward along with an increase in the amount of time customers have to spend on the phone with your agents, that indicates improving handle times would most likely improve customer satisfaction.
The drawbacks of CSAT
The biggest drawback of CSAT is that the definition of satisfied can vary significantly between customers. What does “satisfied” really mean?
Some customers may be satisfied with a longer resolution time as long as you’re working on it and communicating well, while others will be highly dissatisfied in the same situation. This variation can make it difficult to understand if your CSAT score actually tells you something significant.
CSAT also tends to measure only short-term sentiment because the focus is on the most recent interaction. You could have a customer highly satisfied with your product but unsatisfied with a particular support interaction or vice-versa. By itself, CSAT may not give you a complete picture of how satisfied your customers really are across the board.
Five questions to ask to determine which CX metric is right for you
To determine if you should be using NPS, CES, or CSAT, ask yourself the following questions:
- What is your overall CX goal? If you have a specific goal of raising loyalty, for example, focus on gathering CES data and improving those scores in the 1 – 4 or 5 range.
- How much effort will it take to implement one or more of these metrics? The right tool can make capturing customer feedback effortless. But when you’re in a bind, it’s often easiest to start measuring the metric that’s easiest to implement, then add in additional metrics over time.
- Will this be a company-wide initiative or just a customer support initiative? CSAT measures customers support interactions really well. CES can measure both customer support interactions and purchase interactions. NPS is better for tracking overall company and brand loyalty. What’s your focus?
- Are you more concerned with individual interactions or overall sentiment? CSAT and CES measure short-term satisfaction with a particular interaction or set of interactions. NPS measures how customers feel overall and is a better fit for understanding customers’ long-term sentiment.
- Is there an opportunity to implement all three metrics? Using NPS, CES, and CSAT will give you the most complete view of customer sentiment, loyalty, and satisfaction. You probably shouldn’t ask them all in the same survey, but implementing each at strategic points in the customer journey can be really effective.
More resources to help you take action
NPS, CES, and CSAT may work well alone (despite their flaws), but combining them across your customer journey can give you the most holistic view of your customers. Measuring the right CX metrics is the first step in using customer feedback to drive your business forward.
Remember, there is no perfect metric. Use your best judgment, follow best practices where possible, and do what makes sense for your business. The important part is consistently taking action to improve the customer experience, getting more feedback, and then taking more action on that new feedback.
This post only scratched the surface of these three popular CX metrics. For more in-depth information on NPS, CES, and CSAT (and tons of other stuff), check out Nicereply’s resources page, and in case you have any questions visit Nicereply’s help center.
How did you like this blog?


![TOP Questions for CSAT, NPS & CES [Free resource]](https://www.nicereply.com/blog/wp-content/uploads/2021/08/Analytics-update-II-Header-2-1024x512.png)


