Each of these metrics asks a different question and aims to address a different part of the experience you provide.
Every business, product, and support team is bound to have some quirks and weak spots. Some, you know about, but some remain yet to be discovered. But guess what. Oftentimes your customers discover things about your product still hidden to your team.
In psychology, we refer to this as the Johari window – a framework for self-awareness framework developed by psychologists Joseph Luft and Harrington Ingham in 1955.

It’s the blind spot of Johari Window, where customer feedback can really make the difference.
Measuring Customer Satisfaction in Zendesk
Measuring customer satisfaction is a great way to start exploring it. Asking your customers about their experience with you shows that you care, it gives them a voice, and most importantly, provides you with useful data. Data, which you can use to fill in your blind spot. Once you know what the issue is, you can use this knowledge to improve your product, educate your agents, or tweak your support process to fix those issues.
Zendesk has a native, though a somewhat rudimentary solution to help you start doing this. You can use it to survey your customers via email survey after you resolve their support tickets.
Alternatively, you can choose a dedicated tool to get an access to a wider array of options and customizations, like different scales, placing surveys inside of conversation emails, and branding the survey. You can read more about whether to get a dedicated survey tool or not here.
Moving past CSAT
While CSAT surveys will provide you with plenty of feedback, in the beginning, chances are you’ll hit a point of diminishing return as you start moving into the higher 90s of your CSAT score. As you implement all the low-hanging fruit, you’ll start to get less and less new actionable feedback from the same CSAT survey.
One solution might be to change the wording of your CSAT survey question to combat this. A better way to combat this would be to introduce a new survey into your feedback program. Perhaps one with a slightly different focus than CSAT.
Let’s get the bad news out of the way first. There is currently no native way to measure any other customer satisfaction metric apart from CSAT in Zendesk. Simply said, Zendesk’s plain two-button after-resolution survey is all you’re gonna get.
Luckily there are some 3rd party options that allow you to survey for other metrics. Using Nicereply, you can measure CSAT as well as 2 more well-established CX metrics – Net Promoter Score and Customer Effort Score. Each has its merit, so let’s take a look at them.
Measuring Net Promoter Score (NPS) in Zendesk
NPS was developed by Bain&Co almost two decades ago as the ultimate question to gauge the loyalty of your customers. Based on their extensive research, the now legendary question “How likely is it that you would recommend this company to a friend or colleague?” is the one that correlates the most with the future growth of businesses.
You can use 3rd party tools like Nicereply to set up your own NPS surveys with your Zendesk account. Nicereply allows you to create transactional after-resolution surveys, as well as place the NPS survey into any email templates you use in your workflow. You can also use campaigns to send the NPS survey to a list of customers and repeat this regularly.
Differences between NPS and CSAT
First of all, CSAT surveys usually ask questions specifically related to the performance of your support department, or an individual agent. NPS, on the other hand, asks a broad question about the company as a whole. Insights gathered from your NPS surveys can have an impact lasting far beyond your support team, with possible stakeholders being in your marketing and product departments as well.
While CSAT is typically a transactional metric, with NPS you can choose between the transactional or the relational approach. Transactional NPS would be measured in a very similar way to your CSAT surveys and that is via an after-resolution survey. When measuring relational NPS, you instead send the NPS survey regularly (usually quarterly or yearly, but this also depends on your specific customer journey) to your entire customer base or a selected segment.
Combining NPS and CSAT
NPS and CSAT both ask your customers a different question, so combining results of these two surveys can reveal unique insights about your most loyal brand advocates, as well as our customers most at risk of churn.
Using free, easy-to-use software Plot.ly, you can plot a graph that shows NPS and CSAT data along two axes. You can use this graph to divide your customers into four main categories:
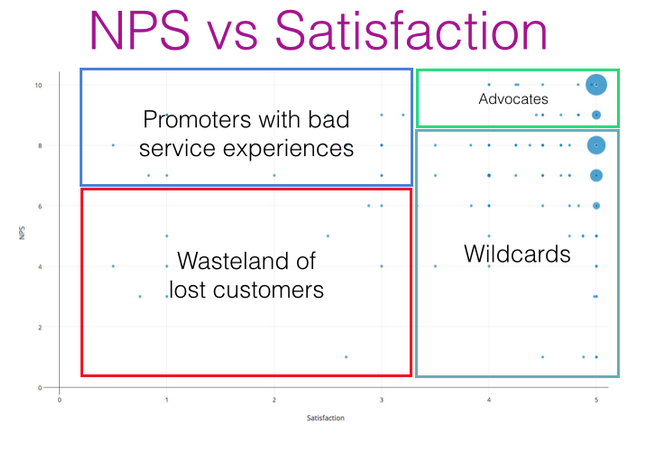
1. The wasteland of lost customers
Unfortunately, these customers are at the highest risk of churn. They’re neither satisfied nor loyal, and it isn’t worth investing much of your efforts to retain them. Let these customers go.
2. Wildcards
Wildcards are an interesting quadrant. They are satisfied but disloyal customers who will be easily wooed away by your competitors.
These are your customers who are quite likely to churn. They may be impressed by the quality of your support, but not at the product bugs that led them there in the first place.
You can engage these customers by adding value to your product and educating them on product features to increase their loyalty.
3. Promoters with bad service experiences
These are your customers who love your brand but have suffered a bad experience with your company. Maybe they love your product, but their interactions with your customer support haven’t been up-to-scratch.
These are customers worth investing more time in to bring them up to the level of Advocates.
4. Advocates
You’ve struck gold with your customer Advocates. Advocates are loyal, impressed with your product support, and very likely to recommend your company to their networks.
You can use these customers for referrals, testimonials, and case studies.
Measuring Customer Effort Score (CES) with Zendesk
Customer Effort Score is a CX metric developed by CEB, and its main premise is that customers like to do business with companies, that are “easy to work with”. The more hoops your customers have to jump through to get what they want, the less loyal will they become. The underlying notion is, that customer can be satisfied with support interaction, but still frustrated with the overall support process.
Once again, to measure CES with Zendesk, you’ll have to use a 3rd party survey solution. Nicereply allows you to measure CES via an email survey after the issue is resolved. While it is technically possible to place the CES survey into other emails as well, the nature of the metric lends itself particularly well to after-resolution surveying.
Differences between CES and CSAT
There are 2 main differences between CSAT and CES. First, CES measures your support process as a whole and puts less emphasis on individual agent performance. Second, while CSAT is especially well suited to being surveyed after every customer interaction, it only makes sense to survey for CES after the issue has been resolved.
Bringing it all together
Each of these metrics asks a different question and aims to address a different part of the experience you provide.
At the lowest, most day-to-day operational level, there is CSAT, giving you insights into individual conversations and tickets. You can use this data to evaluate your agents, reward them, and train them better.
Above that rests CES, giving you an overview of your entire support process. Customer Effort Score shows you where your customers get frustrated or stuck. Use this to redesign the way your support department works. What channels do you use? How often do you make customers switch channels or agents? Is it easy to find help on your website, or is finding a direct contact like finding a needle in a haystack? All of these can be effort points for your customers.
On the highest, company-wide level, there is the NPS, measuring the loyalty of your customers and possibly giving you a forecast for your company’s future.
Measure everything
There’s is no such thing as too much data, and when it comes to your customers, it’s better to know more than less. That’s why we recommend measuring all of these CX metrics to get the fullest picture of the experience you provide to your customers.
Based on our experience, helping more than a thousand companies measuring the quality of their support, we recommend the following setup:
- Measure CSAT in every interaction, via Nicereply in-signature CSAT surveys.
- Measure CES once you resolve the ticket in your Zendesk account via an after-resolution survey.
- Measure NPS quarterly via a survey campaign sent to your customers.
Next steps
If you already have a Nicereply account, you can follow these manuals to implement this survey workflow.
- Follow this guide to include a CSAT survey in the signature of every email you send from your Zendesk account
- Follow this guide to send an after-resolution CES survey to your customers once you resolve a ticket in Zendesk
If not, you can read more about our Zendesk integration and create one here.
How did you like this blog?