


Clinical applications for healthcare AI are rapidly expanding, but many barriers remain, preventing widespread adoption. Among these barriers is a critical unanswered question: What happens after the AI is deployed to production? Answering this question currently requires contemporaneous data, which is time-intensive and expensive to obtain. Our solution, CheXstray, allows robust monitoring of AI solutions without ground truth by measuring drift with readily available multimodal data and merging the results into a single, easily tracked statistic.
About the authors:
- Matthew Lungren MD MPH, Chief Medical Information Officer, Nuance Communications
- Ivan Tarapov, Group Manager, Medical Imaging AI, Microsoft
- Jameson Merkow, Principal Software Engineer, Medical Imaging AI, Microsoft
- Stephen Kaiser, Strategic Client Technology Lead, Microsoft
Introduction
Clinical applications of healthcare AI have significantly expanded over the past 5 years, as shown by a greater volume of academic publications and acceleration of commercial clearances. Despite nearly 350 AI/ML-enabled medical devices cleared by the FDA, actual use of AI solutions in clinical workflows has been limited. The barriers to widespread adoption are multi-faceted; one of these is a critical and difficult to answer question: What happens after the AI goes into production?
Even though it is well documented that AI solutions behave differently in the clinic and even top performing systems show a steady decline in reliability, there are no industry wide standards nor any regulatory requirements for monitoring of AI solutions in healthcare. This lack of answers implies an unrealistic expectation that input data and performance will remain static indefinitely, even though this is known to be false. Without reliable guards against data drift and performance degradation, we risk long-term deterioration of effective AI solutions and ultimately jeopardize patient safety.
There are a variety of challenges to machine-learning (ML) monitoring in healthcare. Unlike traditional ML systems that have built-in methods of measuring performance such as click-through-rate measurement and other user engagement tools, healthcare ML systems lack reliable tools to capture contemporaneous performance, mainly because ground truth is not readily available, or significant effort is needed to validate performance. Furthermore, an enormous volume of metadata accompanies most healthcare data, supplying direct insights into data drift; this data includes patient demographics, medical device specifications, and capture environments. However, the form of this data is rarely numeric and may be inconsistent between sites, adding complexity to data drift detection.
The past two years have taxed our already fragile healthcare ecosystems, and at Microsoft we are always looking for ways to drive better decision making, and tackle some of the toughest challenges in healthcare. Together with the Stanford Center for Artificial Intelligence in Medicine and Imaging (AIMI), we recently explored a data driven approach to healthcare AI monitoring with our solution framework, CheXstray. CheXstray makes a number of key contributions including: (1) a multimodal input embedding that includes patient demographics, imaging metadata and pixel based statistics; (2) a methodology for measuring + unifying a variety of drift metrics; (3) new insights into unique challenges with proposed solutions for healthcare AI monitoring; and (4) creation of a modular open-source toolkit, including a demonstration using public datasets, allowing the research community to build and validate their own custom monitoring systems.
CheXstray
With CheXstray, we break down healthcare data monitoring into four steps:
- Generating samples by extracting a multi-modal, per-input embedding
- Gathering a collection of samples to test for data drift
- Calculating individual (unimodal) metrics through statistical tests
- Unifying metrics using normalization and weighted aggregation to show a robust metric for distribution shift.
The result of this process is a single unified, multi-modal concordance (MMC) metric that measures the degree to which the data has drifted from a reference set. See Figure 1.
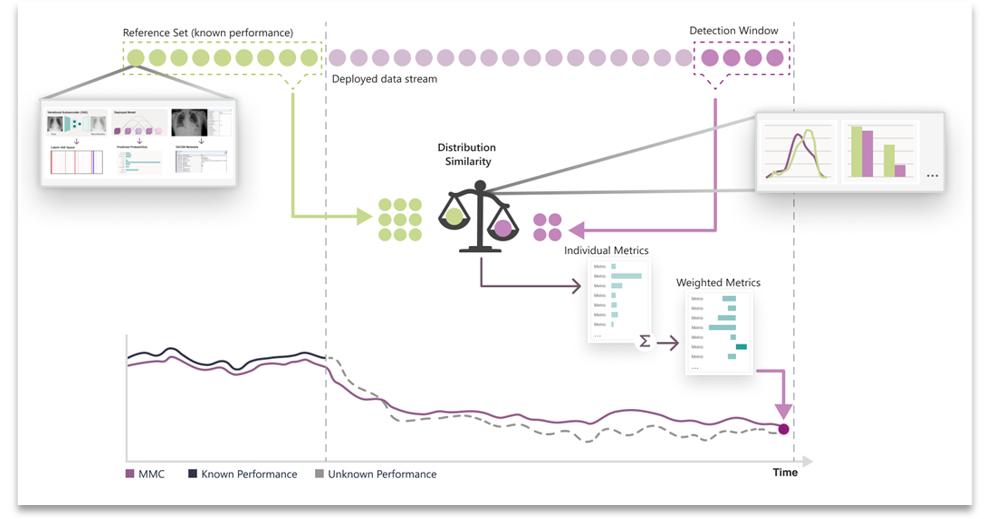
Figure 1. Overview of the CheXstray framework.
Step 1: Feature Extraction
The CheXstray framework begins by extracting a multi-modal embedding of input images that captures information on the image origin, patient demographics, appearance shifts, as well as model certainty and inferred class (label) distributions. This is done by forming a per-image embedding that includes the reconstruction parameters from a variational auto encoder, the raw responses from the AI model, as well as the DICOM metadata.
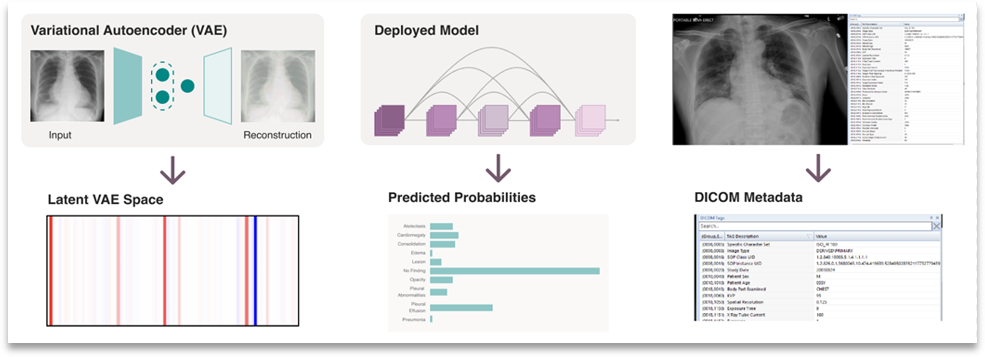
Figure 2. Multi-modal embedding used by CheXstray to monitor changes in a data stream.
Step 2: Detection Windows
Next, our framework gathers a detection window, which is a collection of samples that need to be tested for drift against some reference set. Detection windows were gathered using a sliding window technique that used temporal-based parameters for stride and window length. By default, our method took windowed samples from consecutive days by looking back 30 days; for example, the window for December 31st would include all inputs from December 1st to December 31st.
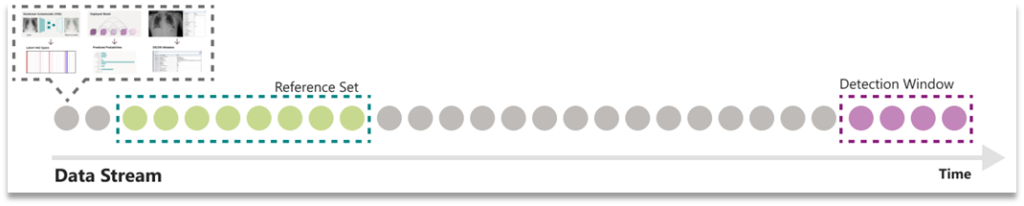
Figure 3. Illustration of reference and detection windows.
Step 3: Individual Metrics
To quantify drift from a detection window from a pre-determined reference set, distribution similarity was calculated on a unimodal basis. Two statistical tests were used for this purpose the X2 test and Kolmogorov-Smirnov (KS) test. Both tests are non-parametric tests that determine the degree to which two distributions differ. The X2 test does so by comparing expected and observed frequencies of two discrete distributions. The KS test compared two distributions by quantifying the distance between their empirical distribution functions.
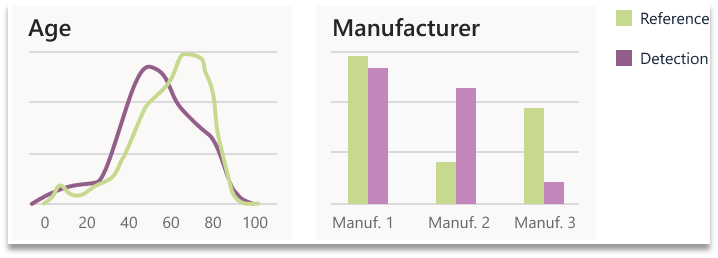
Figure 4. Two examples of individual metrics calculated by comparing the reference and a detection window.
Step 4: Unifying Metrics
Lastly, we need to unify the calculated individual (unimodal) metrics into a single multi-modal concordance metric. To do this, the collection of metrics must be normalized and weighted. Without normalizing individual metric values, there’s no way to determine what fluctuations are typical for a given metric, and metrics from different tests have different numerical bounds. We normalize using an offset and scaling factor, which are automatically calculated by comparing detection windows from within the reference set to the reference set as a whole. Next, we calculate per metric relevancy weighting using the correlation of performance to each metric from within the reference set (where performance is known).
Experimentation
We tested our framework using a publicly available dataset, PadChest. This dataset includes DICOM metadata and, importantly, unmodified exam dates for each exam. Using PadChest, we performed three experimental tests that simulate different real-world drift scenarios. Our first experiment mimics a direct performance degradation scenario where the data distribution shifts to the most difficult exams for the classifier. The second two drift scenarios imitate clinical workflow failures. With changing ICD codes, shifts in patient demographics and inconsistent DICOM metadata, these scenarios have become frequent culprits for data drift in real-world clinics. In the first clinical workflow failure experiment, we simulated a metadata filter failure which causes the classifier to analyze unexpected or unapproved exams. In the second clinical workflow experiment, we investigated how our framework handles a scenario wherein the patient age distribution shifts but there is no metadata to directly detect such a change. All three experiments start with an unmodified data stream and include at least one “drift date” – a date when we induced drift though data stream modification. The two clinical workflow experiments include two “drift dates.”
Performance Degradation
Our principal experiment shows that it is possible to infer performance degradation using our drift metric. To test this, we restricted the input data stream to only the most difficult data starting at drift date A (See Figure 5). Specifically, we captured the ground-truth negative exams with the highest predictive scores, as well as positive exams with the lowest predictive scores. For each trial, we adjusted the difficulty of the test data by varying the inclusion criteria based on a quantile target value (Q). For example, when Q=0.25, we restricted the input to the top 25% (by score) of exams among negatives, and the bottom 25% among positives on a class by class basis.
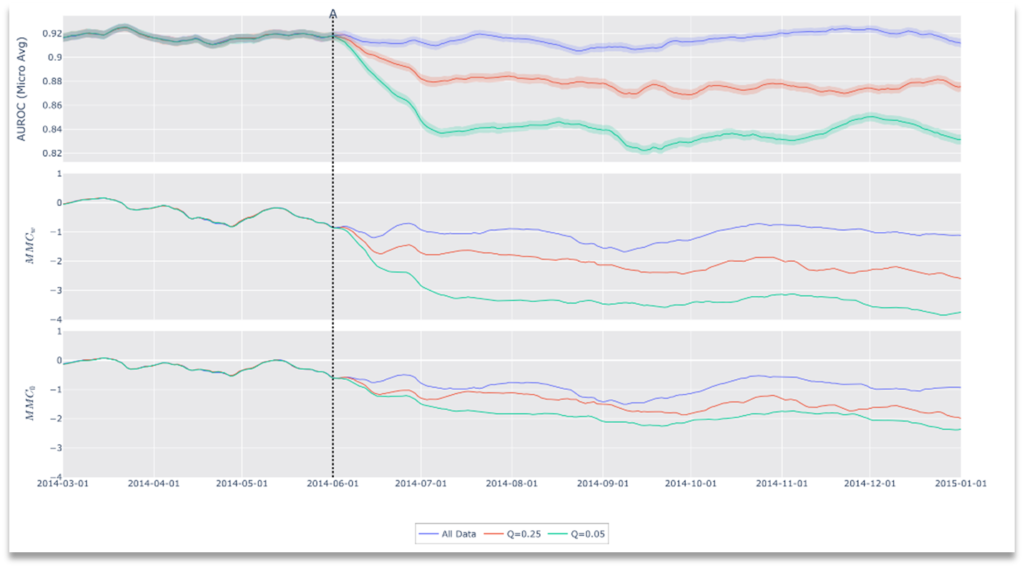
Figure 5. Results of Drift Scenario 1, Performance Degradation.
Clinical Workflow Failure: Metadata Filter Error
During our second experiment, we investigated if our framework could detect changes in the data stream resulting from a metadata failure. Typical clinical workflows route incoming data using metadata of inbound DICOMs. This ensures availability of data to the correct clinicians, and is an integral part of compliance and indicated use for medical devices. Those familiar with clinical DICOMs are aware that DICOM metadata is notoriously inconsistent, often differing between scanner models, manufacturers and even firmware version. Normally a clinician easily alerts IT in case of a routing error, however, in automated workflows (like those involving AI systems), these errors can go unnoticed, potentially leading to contraindicated use.
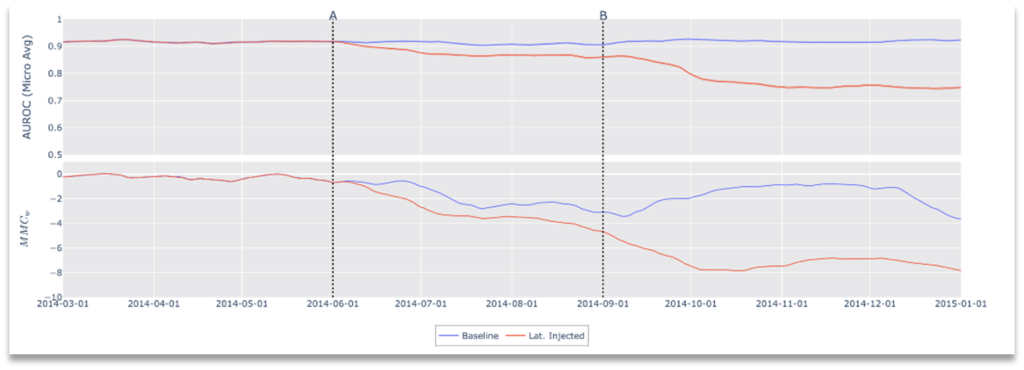
Figure 6. Results of Drift Scenario 2, Clinical Workflow Failure: Metadata Filter Error.
In this simulated environment, the “indicated use” for the model is frontal x-ray images and, as such, lateral images are a contraindication to the classifier; no lateral x-rays exist in the training data nor validation data, nor would the device have been cleared for use with non-frontal images. In this scenario, we simulate a metadata failure by introducing lateral images to the data stream. Specifically, modification of the data stream occurs at two points in time, representing cascading failures in a clinical workflow. At the start, the data stream includes only frontal images as clinically indicated for the device, then, at point A, we introduce lateral images causing contraindicated use and finally at point B frontal x-rays are removed from the stream leaving only lateral images. As shown in Figure 6, after both modifications we see a drop in performance with a corresponding drop in concordance (increased drift).
Clinical Workflow Failure: No Metadata Available
Some clinical workflows de-identify medical data by stripping personal health information (PHI) from each image, leaving incomplete metadata and in some situations no metadata at all. Depending on which side of this compliance boundary monitoring lies, the original metadata may not be available for drift detection. For this reason, any framework for drift detection must be sensitive to modified or missing metadata. Our framework does not depend on any single input (metadata or otherwise) to calculate drift. To demonstrate this, our final experiment omits all DICOM metadata and induces a patient demographic shift by introducing pediatric patients from a second dataset[1]. Results of this experiment are shown in Figure 7. As with our other experiments, these results demonstrate that performance affecting distribution drifts can be detected by our framework, but furthermore, we show that CheXstray can detect these changes using only appearance information and predictive scores.
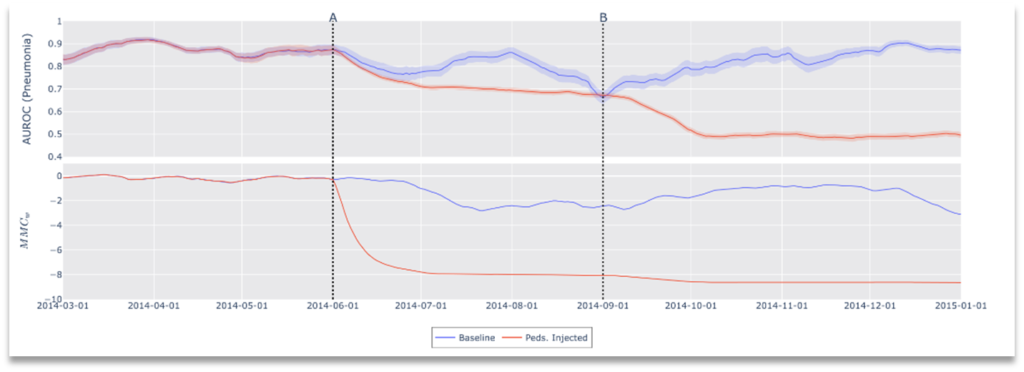
Figure 7. Results of Drift Scenario 3, Clinical Workflow Failure: No metadata available.
Integration with Nuance
This cutting-edge research from Microsoft describes a novel approach for monitoring AI algorithms focused on medical imaging after deployment into clinical workflows. The implications for improving visibility on AI performance in practice could ultimately transform how AI is managed in clinical environments. Every day, the top AI scientists in the world at Microsoft Research develop innovative AI techniques to solve problems that are rapidly adopted into real-world applications across Microsoft products and services. In contrast, these modern technologies haven’t had a similar path to have impact for healthcare applications and customers. But now Microsoft, with innovations like CheXstray, combined with Nuance and solutions like the Nuance Precision Imaging Network (PIN), deliver unprecedented opportunities and real‑time clinical intelligence to multiple imaging stakeholders. This is just one of many examples of how Microsoft + Nuance truly are ‘better together,’ delivering the world’s best technology to the largest clinical imaging network of its kind to tackle the most important problems like never before.
What’s next?
Ensuring continued patient safety with effective AI solutions requires continuous maintenance and monitoring; the lack of regulatory and industry-wide standards remains a critical hurdle to widespread AI adoption into clinical workflows. Our framework, CheXstray, makes critical contributions necessary to achieve real-time drift monitoring for healthcare. We released our open-source framework in the hopes that it will enable others to try their own scenarios and integrate monitoring into their own AI workflows.
You can download the code here or read our academic paper, CheXstray: Real-time Multi-Modal Data Down Concordance for Drift Detection in Medical Imaging AI.
Acknowledgements
Special thanks to Alexandra Eikenbary, Senior Designer for figures and diagrams.
[1] Only Chest x-rays were used, no OCT images.