The Reason
This one is important—so important that I’m not going to try to hook you in by telling you a long, drawn-out story about the day I realized the impact a letter can have—how during an indoor drumline competition, I missed my cue to remove a letter velcroed to my black jumpsuit and played the entire show with the letter A on my chest, hanging helplessly above my tenors, after having made it a point before we rolled out the tarp to go down the drumline and remind everyone when exactly in the show to remove their letters—or how defeated I felt when, on the last run of the show, my wrist clipped the bottom of the A and made me drop a stick.
Letters are important—that’s all. Let’s begin.
The Rant
Does your CS Ops team use a UAT approach to enable your CSMs with SOPs to view ARR, GRR, MRR, ACV, TCV, ARPU, CAC, CES, CSAT, CGR, CLV, DAU, TTFV, MAU, TTO, TTV, FCR, NPS, NRR, and PES within their customer’s CSPs in your CSP to effectively deliver EBRs and meet OKRs that lead to an enhanced ICP?
Ridiculous, right? Let’s all take a breath and chill on the acronyms for a minute—they’re as contagious as they are catchy, leading to overuse, misuse, and in most cases calculations that are incorrect or incomplete. I’m not going to waste time trying to document how to correctly (mathematically) calculate all the three letter acronyms—but feel free to check out our Customer Success Definitions, Calculations, and Lingo…Oh My! if you need a little help there.
Instead, I want to do some level setting on some specific metrics and flaws I see in the industry.
TTV (Time to Value): The philosophy of first value is a binomial: the customer has either received their first point of value, or they haven’t—value or no value. Think of first value like a goal being scored in hockey: the puck must completely cross the line for it to be considered a goal. Where the puck crosses the line, the distance between the puck and the goal line, up high or down low…none of it matters—all that matters is the puck is completely over the line. To accurately calculate time to value, we’re looking for that first win in our customer’s experience with our product that solves one of their business problems—the moment the puck has crossed the goal line. However, the ‘how’ of the puck getting over the line does make a difference in the call on the ice: it can’t be hit in with a high stick, contact can’t be made with the goalie, the player can’t be offsides, etc. The ‘how’ makes the difference and is where we can make the most impact.
If you are calculating Time to Value today but can’t accurately describe the moment in time at which customers receive value based on their business goals and objectives, you are not, in fact, calculating Time to Value. I hear it all the time: “value is when they log in X times” or “value is achieved when onboarding is complete.” This. Is. Not. True. These are process boxes we are checking and patting ourselves on the back for, telling everyone internally our customers love our product or service. Value is defined by the buyer, not decreed by the seller.
Imagine the results of a survey that asked customers when they received value from a product, compared to the lavish number we’re recording. Are you confident in the alignment, and if so, can you readily provide the variables that are contributing to value delivery? My guess is most of us wouldn’t be aligned with the timelines provided by our customers, and hardly any of us are running the continuous analysis to show variable contribution and impact. (Ex: Does successful completion of the Sales to CS handoff deliver earlier value? Or, how is value impacted by total number of users?) This whole process of defining value based on your customer’s goals and use case is not simple, and if it is, I would suggest it’s because you have a really great CS Analyst who is continuously monitoring the variables that are reducing Time to Value and, with the support of the CS Ops organization, has a process in place that captures the customer-specific criteria required to achieve that first value.
NPS (Net Promoter Score): There will be more to come in future rants on NPS, so for now I’m going to keep it simple—if you are collecting NPS but do not have a documented process to reach out to detractors for remediation, especially high touch, top tier, customers, or if you’re collecting NPS by throwing the question in a clunky survey that includes room for open text response, and you don’t have a methodology for analyzing and acting on qualitative data, or if you’re not measuring operational metrics such as survey response rate, why are you collecting NPS?
CSP (Customer Success Platform, Plan, or Professional): Can we all decide right now which one of these terms gets to use this three letter acronym and stick with it? Cause it’s downright confusing to figure out which ‘P’ someone is referring to in the moment; I think Plan called dibs, but I’m open to debate.
CES (Customer Effort Score): For a metric that has the potential to be a real-time feedback avenue for customers, why does the way we ask this question seem like a kid seeking praise from a parent after doing a summersault? It feels awkward to me, like we are desperate in our attempt for the customer to validate our process. I don’t know what the ultimate solution is here, but I suspect there’s a better way. (And please, let me know if you’ve got any ideas!)
DAU (Daily Active Users): If your SaaS offering doesn’t require daily logins for value to be obtained, be cautious how you use this metric. Why heavily weight DAU in health or adoption scores if your product doesn’t support the expectation? Also, keep the number of licenses purchased in mind when looking at this number: if Customer A only purchased one license, assuming your product supports the expectation of daily usage, and that one user logs in daily, that customer wouldn’t be inferior to Customer B who purchased fifty licenses but has twenty daily users.
NRR (Net Revenue Retention): You’re perfect—never change. Truly the king of CS metrics.
RYG (Red/Yellow/Green): If you are determining your customer’s health based on a single variable—specifically CSM sentiment—please contact ESG promptly for assistance. I know how that sounds, but it’s time to step it up! Like NPS, there will be a specific rant in the future that will dive into customer health, so let’s just talk about the basics. Your health score should include multiple variables. If you do have a robust health scoring model, how do you know your customer’s health score is an accurate reflection of their behaviors? (Hint: the answer is regression analysis.) If you can’t mathematically prove why/how the variables in your health score are contributing, reread this section. If you can mathematically show the relationships between each variable’s contribution to health score, then join me in a moment of giving ChurnZero’s marketing team props for the name of their conference series, BIG RYG (pronounced big-rig). Brilliant.
ARPU (Average Revenue Per User): You’re the reason our TV subscription services are always increasing. You know who you are!
ICP (Ideal Customer Profile): This one’s for the executives: If you think your company has an ICP, but the individual contributors of your organization who interact with customers (Customer Success Managers, Sales Reps, Account Executives, Analysts, etc.) can’t fully dictate the variables that make up your ICP, or at the very least have access to reference the documentation of those variables—it’s time for a roadshow.
In all seriousness, there is a lot to choose from to focus on—especially if your CS organization is in the building phase; so where do we start?
The Resolution
With so many metrics to potentially focus on, it can be extremely tempting to see the list of three letter acronyms and impulsively act on determining the calculation without building the necessary foundation to enable action. (I remember the frenzy that CAC had on Customer Success.) To be clear, it’s okay to measure anything and everything you can—especially if you have an Analyst who can run different scenario-based models on the data point; however, the real clarity and action come when we take the time in the beginning to document and define what we are measuring, why it’s important, the action it will drive, and the net impact it will have on the organization and your customers’ business objectives.
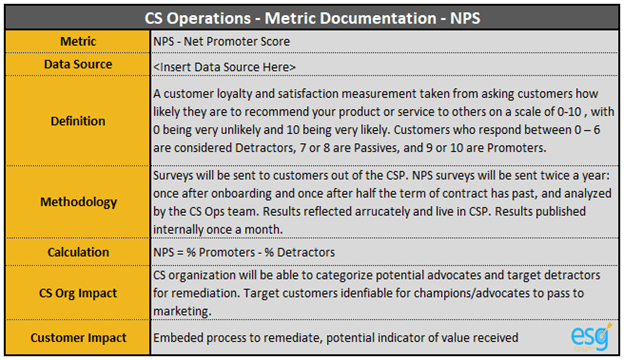
Keep it simple. Include the following seven components as a foundation in your documentation for your metrics:
- Metric –the metric that is being tracked
- Data Source –where the data lives/where you are retrieving it from, including field names
- Definition –the purpose of the metric: what is it?
- Methodology –how the metric is collected, including process, systems/tools, and people
- Calculation – the mathematical equation for the metric
- CS Org Impact – the impact the metric will have on the actions the broader CS organization can drive
- Customer Impact – the impact the metric will have on your customer; how is your customer going to benefit from the collection of this metric?
Below is a very basic example of what this could look like—format is somewhat irrelevant, as long as it is documented, strategized, and available to show, both internally within the CS organization and cross-functionally.
To focus and magnify your documentation even further, you might consider adding the following: how the metric aligns with your organizational charter, any data stewards or data source dependencies that impact the automation or receiving of the metric, organizations outside CS that you rely on for the metric and their dependencies, where/when in the customer journey the metric is executed, and any future phase planning that may adapt, modify, or alter components of the metric.
Each metric that you choose to collect, and each data point that is collected from your customers, needs to have purpose, and the ability to positively impact your company and your customer’s business. If through this process we discover that a metric we are set on collecting isn’t leading to action that will positively impact the customer, we may need to reconsider if the time/effort/money required to collect the metric outweighs the lack of impact it has on the customer.
For anyone wondering why this is valuable, let me close with a few reasons to highlight the value of going through this process.
- The Calculation: If nothing else, by documenting the equation you’re using, especially if altered from the standard industry definitions, you can easily showcase the ‘how’ to other internal organizations who may be tracking a similar or identical but slightly differently calculated metric. The most common use case I come across here involves data sources not matching, which leads to the next point…
- Cross-Organizational Collaboration: Imagine marketing asking how TTV is calculated because they want to launch a targeted value campaign, but you don’t have anything documented. They have access to CRM data, of course, but aren’t connected to your CS Platform. Now you have to spend an hour on a call explaining the differences between data, the calculation, and the dependencies you face. Now imagine if that call was five minutes to simply validate understandings of what’s in your documentation and maybe answer a question or two.
- The Success Plan for Analysts: In my experience, most of the information I’ve outlined lives in one, maybe two, minds and because of workload and deliverables, those minds don’t have time to document their process—new requests come in for more metrics, more data, more insight, and the work continues. All it takes is that one person to go on vacation or leave the company, and the entire team scrambles to try and recreate, learn, and action the process. By implementing this documentation process in the beginning—before any data is organized, connected, or collected—we can use it as a guide to implement, modify, and action the metrics we analyze. It becomes a living document for Analysts to run the numbers behind the business and deliver the results and insights the organization ultimately seeks.
Your business is unique—your customers have unique needs and objectives, and with that in mind none of what I’ve said today is intended to negate or contradict the metrics your organization chooses to prioritize. Our role as CS Analysts is to continuously run experiments to try and get the most accurate predictions and models possible to deliver insights to the CS organization; that means to some extent, we should be looking at all of these metrics, running comparison tests to see if there are additional variables impacting our health, NPS, retention and renewal rates…But before you dive into to the data, take a moment to document the why, make sure it aligns with the objectives you’re looking to achieve, and then UAT test with the CSMs to develop SOPs and automate CTAs to bring a positive impact on ARR, GRR, MRR, ACV, TCV, ARPU, CAC, CES, CSAT, CGR, CLV, DAU, TTFV, MAU, TTO, TTV, FCR, NPS, NRR, and PES—had to get that last one out of my system. Until next week.
Missed last week’s installment of Rants of a Customer Success Analyst? Go back and read! And keep an eye out for the next Reason, Rant, and Resolution next week.