There’s a new kid on the block of customer metrics, and it might be one of the most accurate individual predictors of churn we can find.
What is this incredible metric, you ask? It’s Product Engagement Score (PES), and if you’ve never heard of it, you might be missing out!
While NPS is a tried-and-true metric that many Customer Success organizations incorporate into their overall customer health score, ultimately used to predict and mitigate churn, we know that this may not be the most accurate way to do this. NPS uses a simple scale and has the advantage of being quick and easy for customers to fill out. The industry depends on NPS scores to provide insight into customer satisfaction, account performance, and risk. It’s a very handy metric to quantify something that is incredibly critical but elusive to measure. But now, PES is on the scene with some new customer intelligence data that you can really sink your teeth into.
First things first – what does NPS measure, exactly?
Net Promoter Score (NPS) is a very simple customer survey that asks a customer to rate how likely they are to recommend your product or service to others on a scale of zero to ten. Because it’s so simple and standardized, it’s become the go-to Voice of the Customer (VoC) metric for Customer Success. It’s a helpful leading indicator for customer retention, growth, and churn. Its strength lies in the question itself. It doesn’t simply ask if a customer passively likes you. It asks if they would actively recommend you to others. Because of this, the industry considers NPS a good indicator for customer evangelism – who loves you so much that they will sing your praises to the world?
However, NPS has its drawbacks. While NPS can serve as a leading indicator, it also serves as a lagging indicator of customer loyalty, meaning that it helps to validate behavior rather than predict it. Many experts find that this “how likely” question is not actionable and are skeptical of the subjective nature of relying so heavily on a self-reported customer metric.
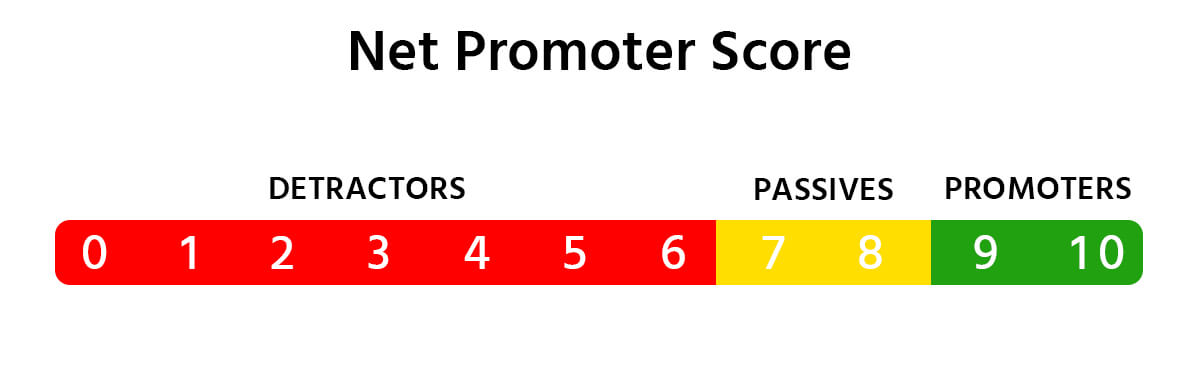
A user may think they have choices from zero to ten, but in reality, we break their responses down into only three categories: detractors, passives, and promoters. Anyone giving a score from zero to six is considered a detractor and unlikely to endorse your product. Seven to eight is neutral, and nine or ten are the cream of the crop customers, promoters. A user could be on the fence about you and choose a six, but the system considers a score of six the same as if that user chose zero. There’s no built-in way to drill down to see what a customer really feels about you. Sure, a CSM could technically download the information into an Excel spreadsheet and track down the actual number a customer gave you, but if they didn’t leave any additional comments, you’re still left with a number that doesn’t give you a whole lot of insight into whether or not your customer will renew or churn.
Product Engagement Score has the right stuff
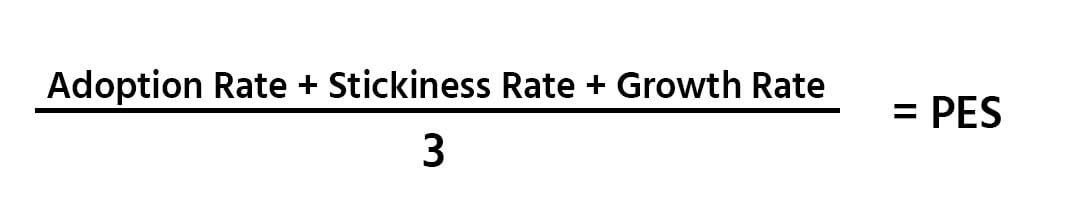
Product Engagement Score dives much deeper into how your customers interact with and utilize your product or service. It’s composed of three elements: adoption, stickiness, and growth.
Adoption is the percentage of users or accounts that are utilizing the critical features of your product. These are the parts of your offering that you know lead to successful usage and growth.
Stickiness is a monthly rolling average of active users. These are your customers who are consistently coming back to use your solution again and again. You can take this as a percentage of users returning daily or monthly, depending on what makes the most sense for your business.
Growth is the percentage growth rate of users or accounts during a set time period, compounded to your annual growth rate.
To calculate your PES, you add these three percentages together and divide that number by three to get the average.
Your PES is a percentage that distills down crucial product metrics into one straightforward number. It was initially created to help Product teams see where there were gaps in the user experience. There is a great deal of product engagement data out there and various ways of manipulating that data. PES emerged as a tidy way to pinpoint problem areas in your product’s performance and with your customers’ usage of said product.
Step by step! Working with Product to predict churn
So, how does all this add up to being able to predict churn better than NPS? For starters, PES is more nuanced and allows you to drill down into the data to discover more actionable intelligence. A CSM with this information can see, for example, that an account’s users aren’t logging in as much as they were during onboarding, and quickly take action. PES can indicate that a customer isn’t using essential features that would help them derive maximum value from your product. With these insights, you can analyze greater customer trends and develop communication campaigns to educate users about key features they’re overlooking.
PES is a more objective representation of product engagement than NPS. It’s not based on sentiment, which can change from one moment to the next. It gives you the facts – is a customer using your product, and are they extracting value or not? This layered, more nuanced view is a more accurate way to predict churn because it signals utility and value. While we know that CS teams aren’t going to throw NPS out the window (nor should they), we also know how connected product engagement is to customer retention. A low PES is going to give you a lot more insight than if a customer clicked on a six versus a seven on the NPS scale.
If CS doesn’t have this data now, chances are, it already lives somewhere with Product. The problem is, Product doesn’t have the bandwidth to own customer outreach if the PES shows something is off. That is Customer Success’s job! It’s another good reason Product and CS should work together to put this data to good use as a powerful metric that will help both organizations more accurately measure customer health and predict churn.