
If you are reading this, you are probably a sales leader who is wondering what to do with that massive amount of data in your CRM. In this guide, we share valuable tips on how to properly use sales insights in order to monitor and improve your team performance and keep everyone on top of important sales updates.
But Wait! What’s a Sales Dashboard?
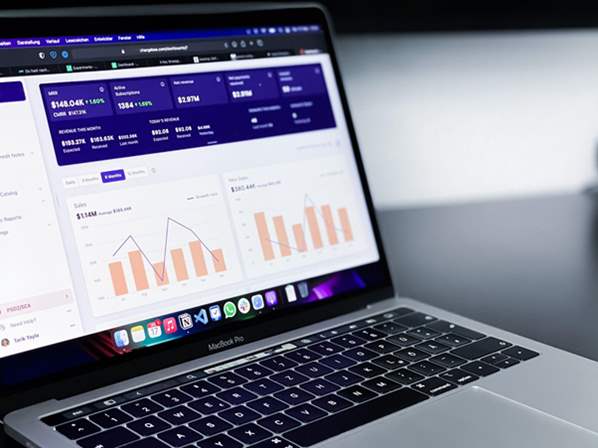
A sales dashboard is a tool and a sales measuring method at the same time. Tools like the Salesforce dashboard are designed to provide you with a birds-eye view on key metrics, current sales activities, and even the individual performance of your sales team members. The data comes from several sources and is automatically “translated” into actionable insights. Let’s get straight to how to use it to monitor your team’s performance the best way.
Step 1. Set True-North Metrics
Properly identified true-north metrics will help you and your team clearly understand what you are currently working towards. This means that you need to outline specific goals for the entire team and individuals to figure out which metrics should be considered true-both metrics. There can be multiple of them at each sales cycle in your business process. Here are several examples of such metrics:
- the number of deals closed;
- average deal size;
- ratio deals closed to deals lost.
Step 2. Set KPIs
KPIs are essential to measuring your team’s performance, and they are usually split into 2 categories:
- Result-oriented metrics – KPIs focused on sales activities output, including win rate, average sales cycle duration, revenue, lead response time, average deal size, follow-up rate, number of leads generated, etc.
- Activity-based metrics – KPIs focused on the inputs needed to reach a certain quota within a period. They may include the number of calls made and emails sent, the number of follow-ups needed to generate a lead, average lead response time, etc.
Step 3. Bring Data Together
Once you set the metrics and KPIs, you know which data threads you need to compile into your sales dashboard. Take as much time for auditing as needed to figure out where all the required data is stored. Here is what you need to find out:
- Which data does your boardroom create, collect, and use?
- Which standalone tools do your reps use for their tasks?
- Which tools does the marketing dept use to collect lead info?
The platforms for auditing include CRMs, email tools, marketing measuring tools, spreadsheets, tracking tools, sales and business intelligence tools, and customer service solutions.
What Makes a Good Sales Dashboard
Regardless of your sales dashboard provider, the tool must do the following:
- have a clear layout to tell you the true story;
- simplify complicated pieces of data;
- focus on what is necessary in your case.
Keep It Minimalistic
Now that you know how to make things work to monitor your team’s performance effectively using a sales dashboard, you should focus on making it look as minimalistic as possible. This will help you to stay on top of all important metrics and save a huge amount of time on overviewing. Good luck to your sales team! Do you feel inspired to set up your sales dashboard? Tell us which metrics you will choose for your dashboard in the comments!