With Cisco FSO Platform, metrics can be reported directly from the code. Unlike using any kind of auto-instrumentation feature, this is useful when a service owner knows what needs to be reported. A typical use case would be enabling reporting of domain specific metrics – like number of items in the catalogue for e-shops, number of unfinished orders, SQL queries to specific table, etc. Basically, anything which might be interesting to observe for some period of time, or compared among different implementation versions.
Hands-on guidance on how to set this up
Open Telemetry has a recommended way of how the metric reporting should be routed to any software. The service which will be reporting the data is going to send them to the open telemetry collector, which is a quite convenient universal receiver, processor and exported of (not only) open telemetry formatted data. Open Telemetry collector will then be configured to relay all the data to the FSO Platform tenant.
The first thing that you need to secure is a FSO Platform tenant, to which the data will flow. I happen to have one ready, but I need to get the principal and clientId and clientSecret used to export data. After logging in, I opened a “Configuration” tab, then selected “Kubernetes and APM,” named my configuration, and followed the information presented to me:
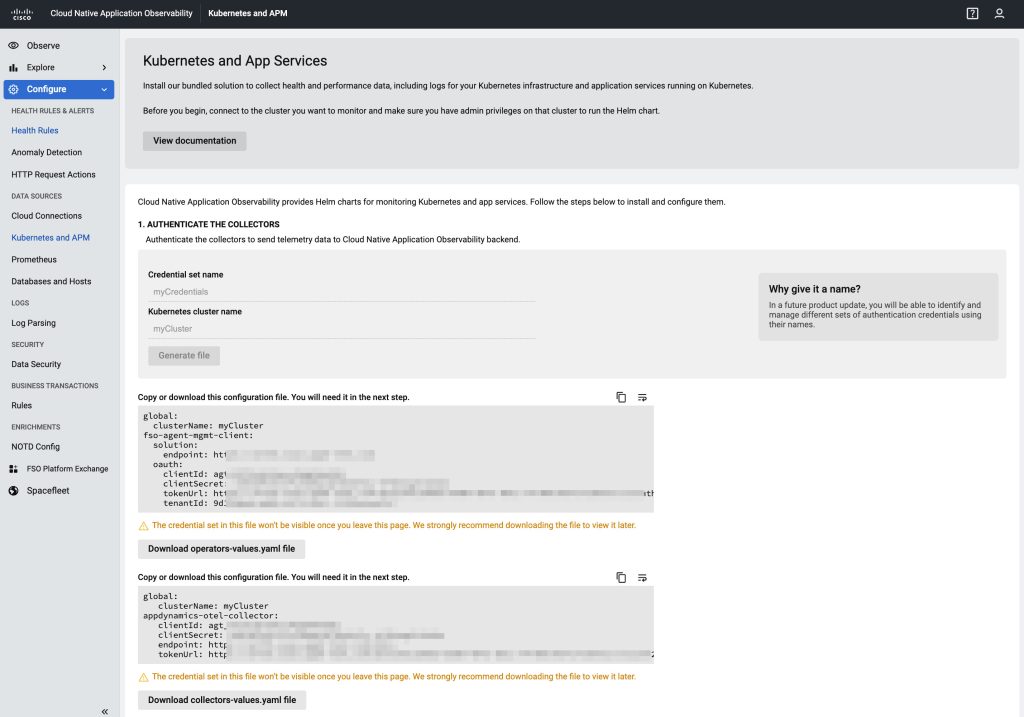
That should be all I need to configure my Open Telemetry collector.
Open Telemetric Collector configuration
Next, I used Docker image otel/opentelemetry-collector-contrib:latest, since that’s the simplest way for me to run the collector. All I need to do is to provide the right configuration, which is done by supplying –config parameter.
After some short research, I decided to use the following configuration:
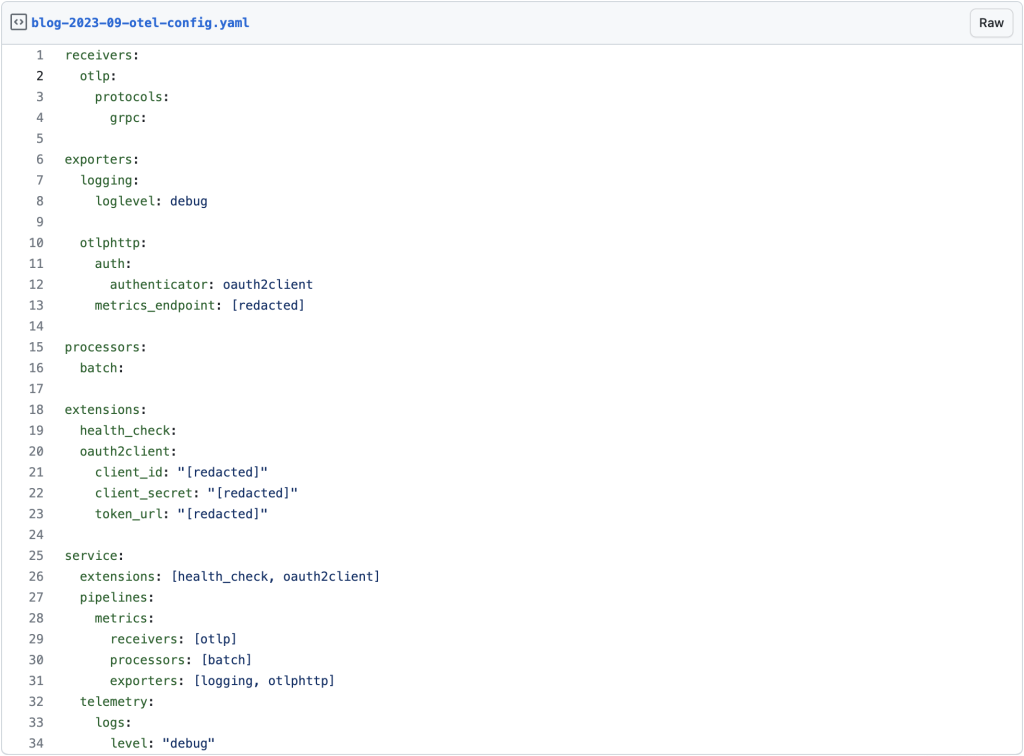
Then the only thing left to do is to start the collector:
% docker run --rm -t -v $PWD/otel-config.yaml:/etc/otel-collector-config.yaml

-p 4317:4317 otel/opentelemetry-collector-contrib:latest --config=/etc/otel-collector-config.yaml
The collector starts really quickly, I only verified that all the extensions I added are initialised, no errors printed out.
My go-to language is Java, so lets try that first. Open Telemetry provides a quite extensive list of SDK libraries for any modern languages and runtimes. The Java SDK seems to be the most mature one on that list. This doesn’t mean that Java is the only choice. Realistically, there is already support for reporting Open Telemetry data from any actively used language. And if not, there is always an option to report data using different receivers. For example, you can use Prometheus or Zipkin support which your programming or runtime environment already has.
Metric Data Source
Since I don’t have any application ready for this experiment, I chose to do the manual instrumentation (it will most likely be more fun anyway).
After setting up a project and a dependency on the latest SDK version available (1.29.0), I put together the following class package com.cisco.fso:
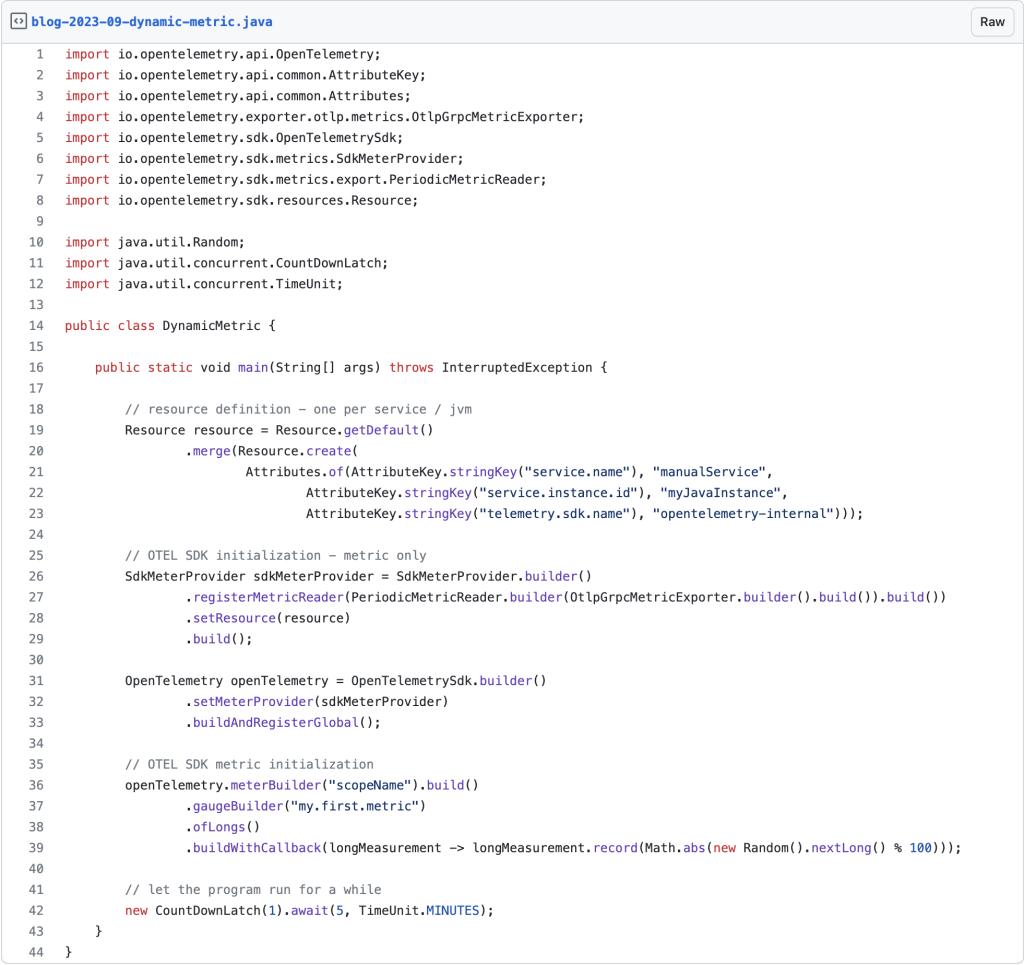
Let’s go through some important parts of this code snippet.
First one is the Resource declaration. In Open Telemetry, every data point needs to be reported in the context of a resource, including metrics. Here I am declaring my resource as something with the attributes service.name and service.instance.id — which is a de-facto standard, described as part of the Open Telemetry semantic conventions.
If you explore that space more, you’ll find lots of other conventions, defining which resource attributes should be reported for various components, like container, pod, service running deployed on some cloud provider and many more. By using service.name and service.instance.id, we are reporting a service. On FSO Platform this is mapped to the type apm:service_instance.
Another part worth mentioning is the metric initialization. You can see that I named my metric “my.first.metric”, set the type to gauge, declared that it will be reporting long values, and registered a callback, which does return random long values. Not very useful, but should be good enough to get some data in.
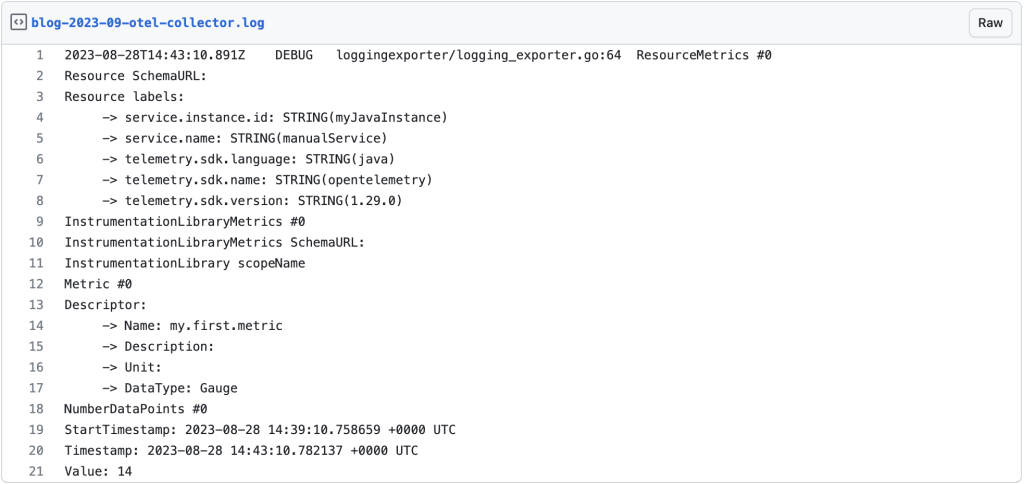
After executing the program, you will see new logs reported by the Open Telemetry Collector we started before:
Exploring ingested metrics using FSO Platform
This is a good sign that the data arrived from my Java program to the collector. Also, the collector contains further logs which suggest that it was able to report the data to the platform. So, let’s get back to the browser and check out whether we can see reported data.
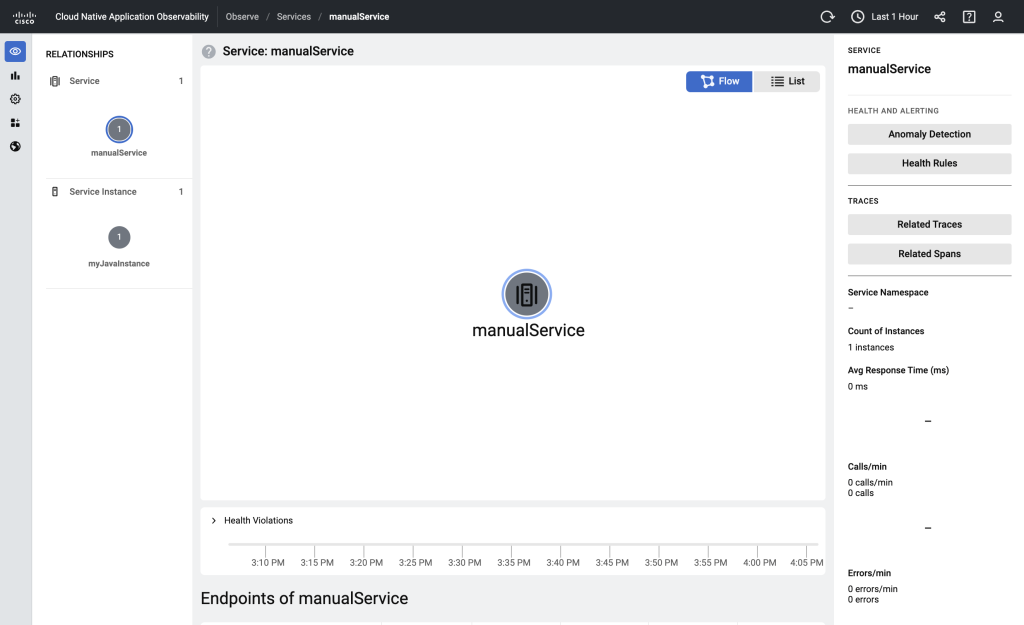
Apparently my service was registered by the platform, but there are not much data reported. And, any metrics which are displayed by default, are not populated. Why is that happening?
All the metrics which are there are derived from spans and traces which would be reported by any standard APM Service and even any framework which you’d be using. The Open Telemetry SDK has nice auto-discoverable features for Spring, Micronaut, and other tools you might be using. After putting some load to your service, you would see those. But that’s not what we want to do today. We want to see our very important “my.first.metric” data points.
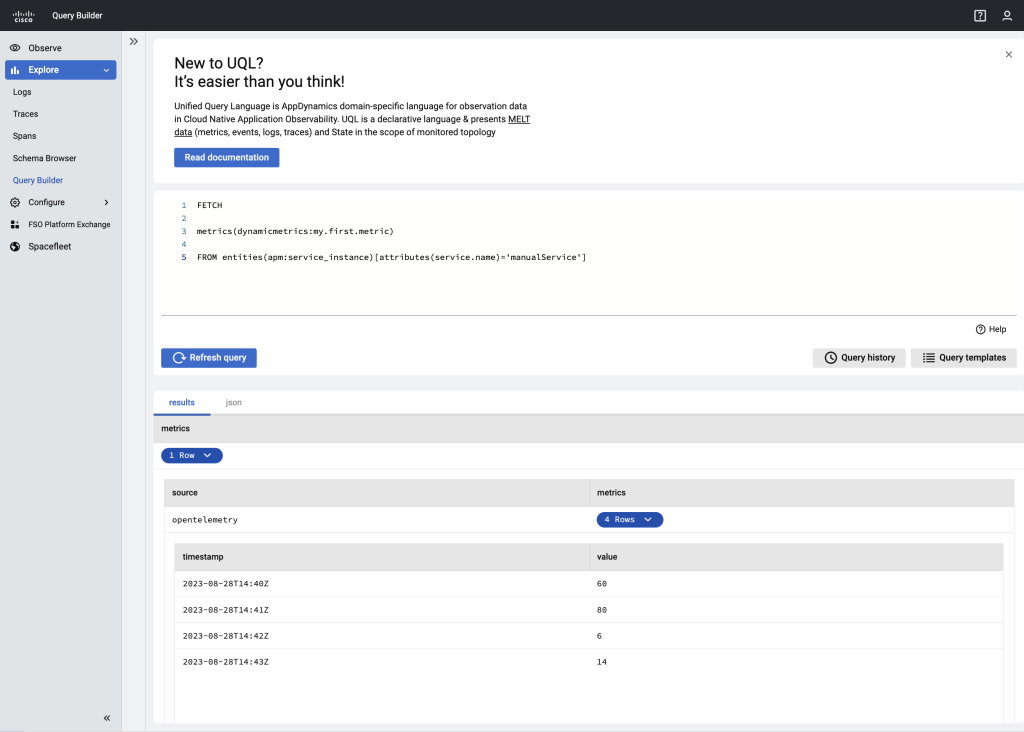
For that, we will need to use Query Builder, a System Application of FSO Platform, which allows you to query stored data directly using Unified Query Language.
FETCH metrics(dynamicmetrics:my.first.metric)
FROM entities(apm:service_instance)[attributes(service.name)='manualService']
This particular query fetches the reported metric for the apm:service_instance, which was mapped from the resource reported using the Java snippet above. It retrieves values of a metric my.first.metric and shows them on the output. The dynamicmetrics string represents a special namespace for metrics, which were ingested but are not defined in any of the solutions which the current tenant is currently subscribed to.
Obviously, this is only the beginning and most of you wouldn’t be only reporting custom metrics by hand, you’d be instrumenting code of your existing applications, infrastructure, cloud providers and anything you can model.
Ready to try? Get stated with Cisco FSO Platform
Related resources


CONNECT WITH US