By comparing your survey results to other companies, you add context to your scores.
You might be looking at your latest survey results and wondering…. Are these good? How do we compare to our competitors? How are other companies in our industry performing when it comes to customer satisfaction? Should we be doing more?
We’re here to help.
Why is benchmarking important?
This is where benchmarking is helpful. By comparing your survey results to other companies, you add context to your scores. Without it, how can you possibly know if your company is outperforming your competitors?
Knowing what similar companies are seeing in their survey results can help you set realistic goals for your own surveys. This is where industry benchmarks come in. If you’re running a telecom company’s customer service department, your competition is consistently seeing very low scores across the board. If you’re working with a technology company, you should be aiming a little higher.
Check out the following benchmarks to see how you compare in CSAT, NPS, and CES, and inspire your own goal setting.
CSAT Benchmarks
Customer satisfaction (CSAT) is measured on a scale from 1-10, or as a percentage. Benchmarks are calculated across the total data set of a large number of responses, or they can be broken down by channel or by industry. Here are some data points that you can use to benchmark your own customer satisfaction scores.
Nicereply
When looking at all scores received through Nicereply CSAT surveys in the last 30 days, the average across all responses is 8.59 out of 10.
Peak Support
Using a variety of data sets, including help desk reports and their own clients’ performance, Peak Support has calculated the following CSAT benchmarks per channel:
Email Support:
High: 96%
Average: 61%
Low: 85%
Chat Support:
High: 96%
Average: 75%
Low: 85%
Phone Support:
High: 95%
Average: 76%
Low: 87%
Zendesk
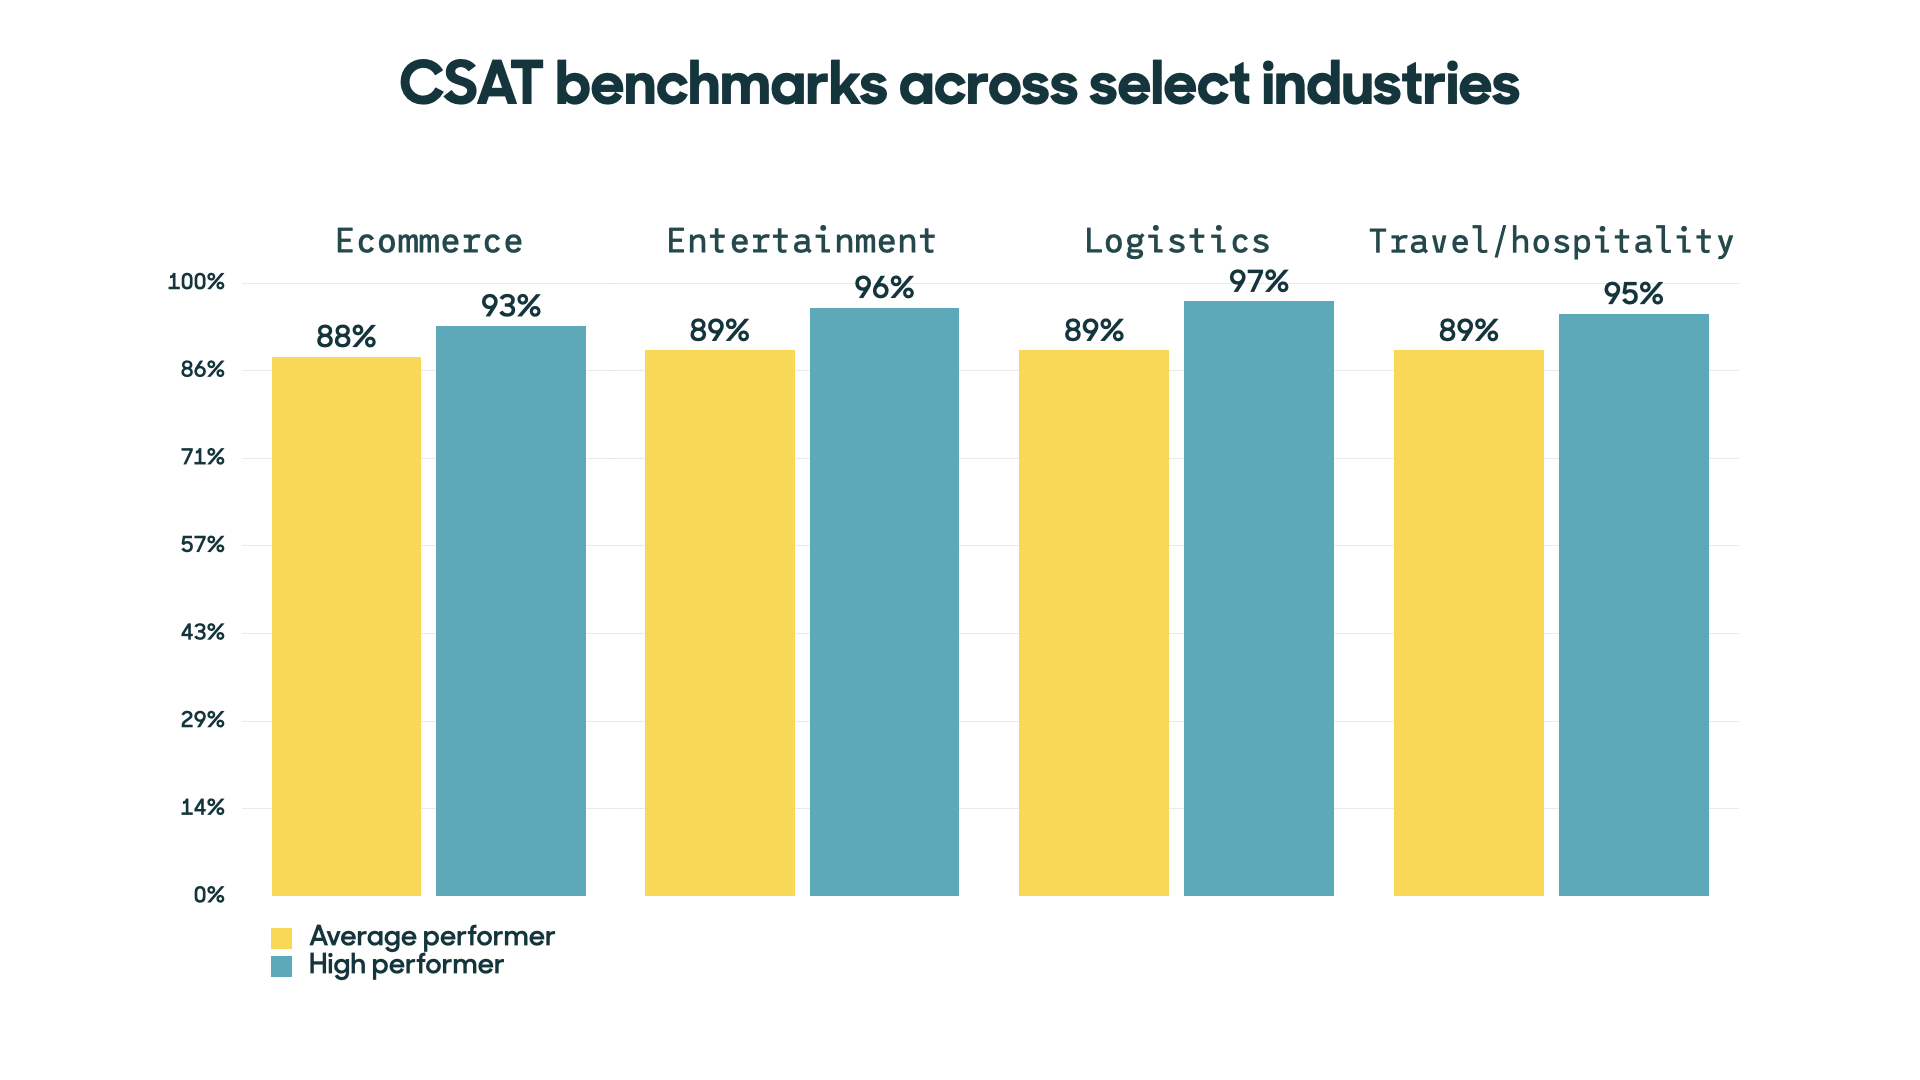
Zendesk calculates separate benchmarks across different industries, using the CSAT survey built into their help desk functionality.
Ecommerce:
High: 93%
Average: 88%
Entertainment:
High: 96%
Average: 89%
Logistics:
High: 97%
Average: 89%
Travel/Hospitality:
High: 95%
Average: 89%
To see more of Zendesk’s customer satisfaction benchmarking, including first reply times, check out their research center and select your own industry.
NPS Benchmarks
Net Promoter Score (NPS) is calculated by subtracting the percentage of respondents who selected 6 or lower from the percentage of respondents who selected 10 or higher. This gives a number between -100 and +100. Benchmark scores are often broken down by industry, or reported by independent brands who are proud of their customers’ loyalty.
Nicereply
When using all of the NPS survey responses received across the last 30 days, we’ve calculated our customers’ average NPS as +17.
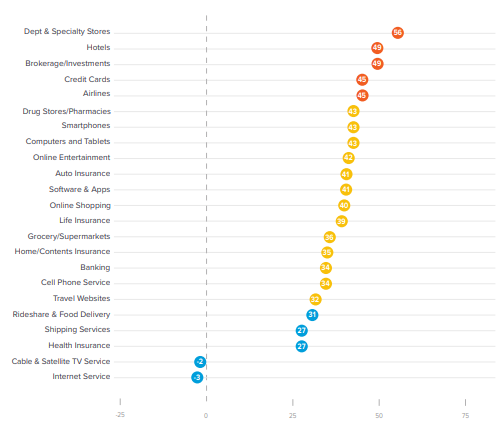
SatMetrix
SatMetrix is the creator and owner of the NPS trademark. Each year they put out a benchmarking report that segments average NPS by industry. As you can see in the graph below, industries vary wildly when it comes to NPS, with specialty stores ranking first at +56, and internet services coming in at -3.
NetPromoter.com
If you want to compare yourself to the best of the best, check out these top performers reported by NetPromoter.com:
- Costco +80
- AirBnB +43
- Flipboard +55
- Ritz Carlton +66
For more benchmarking data, you can purchase NetPromoter.com’s benchmarking report.
CES Benchmarks
Customer Effort Score is measured by calculating the average of scores given on a scale from 1 to 7, as defined in The Effortless Experience by the creators of this important metric. However, some platforms still incorrectly offer CES on a scale from 1 to 5, or even 1 to 10. This makes it difficult to find accurate benchmarks.
Nicereply
When using all of the CES survey responses received across the last 30 days, we’ve calculated our customers’ average CES as 5.99 (out of 7).
The distribution of CES is also important to measure. In 2018, we examined the distribution across all of the CES responses we had collected, as shown below. Even though the average score is close to 6, there are still a significant number of customers who report finding it very difficult (1) to get help.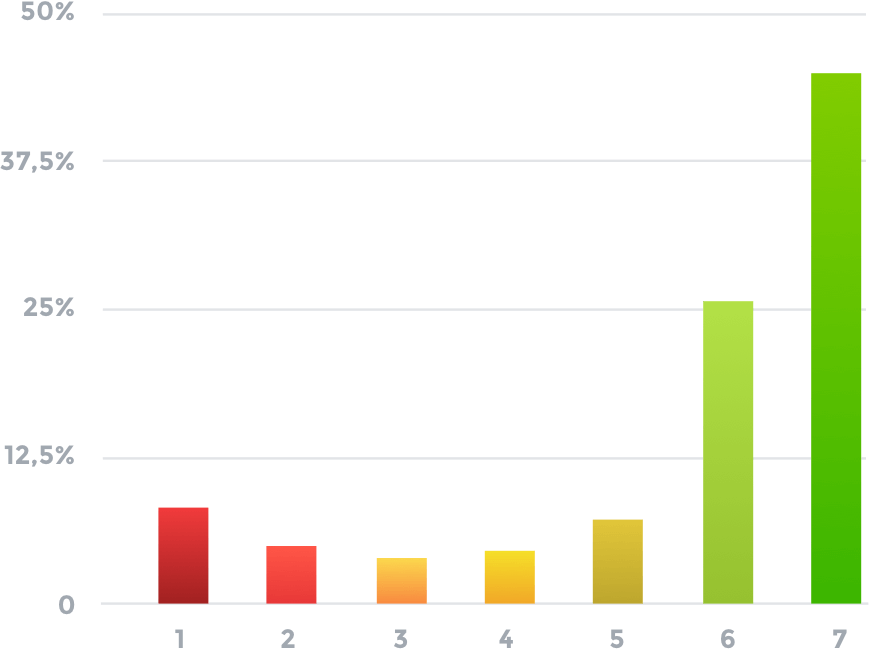
What if my scores aren’t good enough?
If you’re looking at your current scores and thinking that they don’t quite measure up to what you’re seeing here… that’s okay! The fact that you’re measuring your customers’ experience and hoping to make it better means that you’re already on the right track.
There are any number of reasons for your scores to be different than the averages reported here. You may be measuring your scores a different way or your customers might be more discerning. What’s important is that your score trends in the right direction… up!
Here are some tips for improving your scores, whether you’re below average or already a top performer:
CSAT
- Look at the drivers of dissatisfaction. What are the common reasons customers complain about having a bad experience. Take steps to address these common causes.
- Increase your survey response rate. Hearing from more people might show you that you’re closer to average than you think.
- Check out these 11 unconventional ways to improve your customer satisfaction score.
NPS
- Focus on the passives. The customers that respond with 7 or 8 are not necessarily unhappy with your product or service, but they aren’t blown away either. They might be the easiest customers to move to the Promoter category.
- Segment your NPS responses by plan type, demographic information, and how long they’ve been a customer to hone in on who is the most loyal, and who needs more attention.
- Don’t forget about the Promoters! Analyze their responses to see what they like most about your product or service. Make sure that you’re surfacing these features to other users as well.
CES
- Zoom in on those customers that are having the hardest time. What channels are customers who have responded with a 1 or 2 coming from? What problems are they seeking help for? It is far more important to improve the experience of these customers than those who only found it moderately easy. A CEB study found that improving CES responses from 1 to 5 increased loyalty by 22%. However, further improving from 5 to 7 only increases loyalty by a measly 2%.
- Take a walk through your help center as a customer. Find places where it’s not clear how to ask for help. What steps do customers have to take to be able to talk to a human? Where can you make it easier for them to find the right answer themselves? You might be (unpleasantly) surprised at how difficult it’s become to get help.
Comparison is the thief of joy
While it can be tempting to focus on your competitors’ scores, they are not the most important fact. Instead, look at how your scores are trending. Are customers staying loyal to your business? Are you quickly responding to dissatisfied customers when they complete a survey?
Instead of getting wrapped up in benchmarking your customer happiness scores, focus first on how you are analyzing and responding to your own data. That’s where the highest pay-off will come from.
How did you like this blog?