

Customer Service Data is the Nucleus of Your Contact Center: How to Use Data to Inform your Decision Making for Standout Service This Year
About 66% of customers faced problems with the products or services they purchased in 2020. And, nearly two-thirds of that camp felt rage over the issue that popped up or how it was handled.
What’s more? Customers who had breakdowns in their interactions rose 10% over 2019 according to The National Customer Rage Study.
As customers grow restless to get the customer journey they expect, how can you help solve their growing list of grievances?
It’s time to turn to the brain of the operation: your customer service data.
[Download Now] Use the data that lives in your contact center to improve your customer experience
Your customer service data sends you the signals to drive revenue, trim inefficiencies and figure out what your customers actually want out of their experience with your company. Kind of like how your brain sends signals to the rest of your body, guiding how you function, too.
Without using data to inform your decision making, you’re relying on your gut alone. And while instinct certainly has a place in business, you can’t operate at your peak using just your gut.
Customer problems keep growing and so do expectations. The only way to sustain service levels is to learn what’s really happening in your contact center. Here’s how you can use customer service data to inform your decisions and deliver the customer experience your customers beg for this year.
What are different types of customer service data you can measure?
Overwhelming amounts of data only make improving your customer service harder. Instead of collecting data on everything but the kitchen sink, focus your customer data in these core areas.
Interaction data
This type of customer service data is the most obvious source to collect and analyze. Because most of the time, your call center system automatically collects and funnels it to your reporting engine. Interaction data is the thousands of metrics associated with each conversation between your customers and your agents. Your hold times, your service levels, and your abandon rates all fall into this category.
Behavioral data (like feature usage and churn trends)
Behavioral data examines the behaviors of your customers (shocking, I know). It helps you identify trends and patterns beyond your traditional call center metrics. Your behavioral data tells you important tidbits like what product features your customers use (and which ones they neglect). It might guide you to see what services take up more of your support resources than others. And, it might even point to key trends in your interaction data, helping you identify (and stop!) problematic journeys in your call center.
Let’s say you’re reviewing your annual churn rate and you spot a behavioral pattern. Customers who call in for help on the same issues three or more times in a month are more likely to churn. Now, looking at this repeat behavior, you learn that to improve customer retention, you have to improve first contact resolution, first.
Qualitative feedback
Think about your customer surveys and what you learn in your agent 1:1s, here. You need qualitative data to understand customer sentiment and employee engagement. This type of data relies mostly on what you learn by asking questions and actually talking with your customers and employees. And using that qualitative feedback and data, you can build trends and use math to intuit what customers are experiencing.

Agent performance data
There’s some overlap between agent performance data and interaction data. Now obviously, your customer interactions piggyback on your agents’ performance. So, metrics like average handle time can fall into both buckets. The distinction to make here is differentiating between the metrics your agents can control and those they can’t. Your agents can control how long they take to resolve an interaction. They can’t control other interaction metrics like service levels. It’s not your agent’s fault if their coworker overslept and your call center was understaffed.
[Learn More] Measure and improve agent controllable metrics for better ROI in your call center
How do you collect and organize customer data?
Collecting the right data and distilling it down so it makes sense to the right people is key to building better customer service strategies. Here are four ways to collect and visualize your call center data.
Analyze customer interactions
Use your interaction data to learn what’s happening with your customers (and your agents). When you fill out an agent scorecard or your QA team grades an interaction, it’s easy to let subconscious biases steer your scores. And, without more context, these single customer conversations don’t offer a good representation of your agent performance or your customer’s experience. The sample size is simply too small.
So, rather than digging into interactions one at a time, sit down and review a handful of interactions for each of your agents. Don’t just review the outliers. And, don’t just look to the conversations that hit every metric. Turn to multiple interaction types and different use cases to learn what problems customers have and how your agents handle them. Let your data guide you to interactions that need attention, but don’t neglect looking beyond the data point to hear what customers and agents say in the moment.
Talk to your agents 1:1
Ask your team questions to learn what’s tripping them up when they’re helping customers. Are they stuck surfing between too many windows when they’re interacting with customers? Do they have access to the customer history they need for more context?
If your agent has handle times two minutes above their peer group, address it in these conversations. But don’t just reprimand. Ask questions and seek to understand why handle times are off base. Maybe your agent is struggling to find customer data and searching for it drives up his handles times. Or, maybe he’s dealing with angry customer after angry customer and he takes his time to cool the conversation down.
Dig into your processes and tools to fix the disjointed pieces of your customer experience.
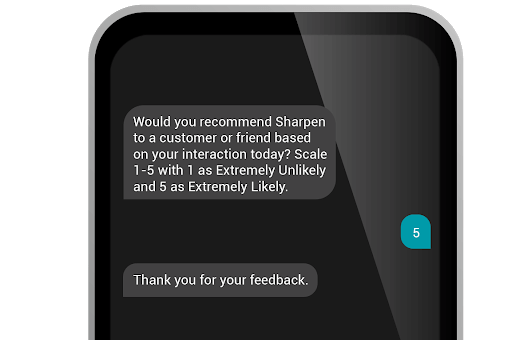
Solicit customer feedback with surveys
Use customer surveys to collect qualitative data from your customers to learn what made their experience or what peeved them enough to tell you about it. Then do something with the information you collect.
A CCW Market Study found that only 11% of customers feel like brands genuinely care about improving their experiences. And, a slim 12% of customers feel like brands actually took action to improve their CX.
While customer surveys don’t provide the most accurate picture of your contact center when viewed alone, they offer an avenue to get direct feedback.
Hearing straight from your customers gives you a line of communication where the message doesn’t get muddied like in a game of telephone. And, it lets your customers know you’re actively asking for feedback so you can make their experience better.
Create dashboards to present your data
Once you’ve collected your data, you can start to organize it and break it down so you can identify important trends and pull out insights to inform your strategies.
Create a real-time support dashboard to view what’s happening with your customers and agents on a daily basis.
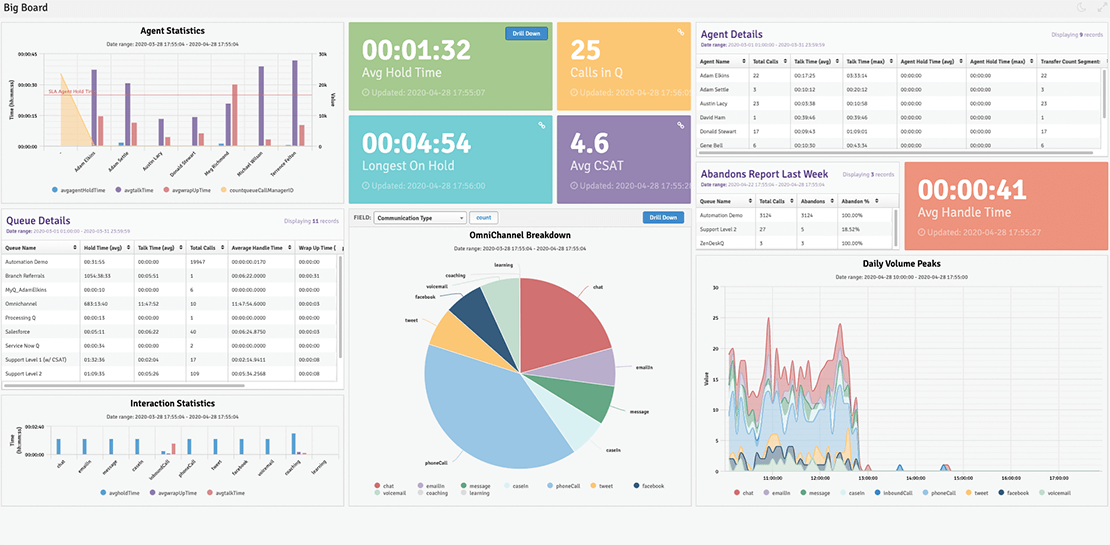
Build out a customer satisfaction dashboard to rope in metrics that impact your customer happiness, like CSAT scores and Active Contact Resolution. And, create agent-specific dashboards with individual performance metrics for your team members. That way they can keep a pulse on performance and understand the importance of the customer service data points they’re measured against.
[Read Next] 4 example call center wallboards & dashboards
What can you do with your customer service data after you collect it?
Your data is only as important as what you do with it. Collecting data doesn’t mean you wave a magic wand and improve your customer experience. The true magic happens when you use your data, analyze it, and distill it down to change your customer service for the better.
Plug your customer data into predictive models
Start by using predictive models to anticipate your future customer needs. Learn when your busy season hits, what day of the week you see spikes in interactions, and what times your customers typically reach out for help. Then, plug all that info into an Erlang calendar to forecast for WFM and schedule the right number of agents during the right shifts. (Or, ring us and we’ll help you.)
Keep your contact center staffed for your peaks and your lulls. Use your data and predictive modeling to set requirements for service levels, so you keep up with your customer’s needs and reach your contact center goals.
Identify pain points in your customer journey
Turns out, customers want to enjoy their entire journey with a company (Do they ever let up?!). That means every interaction with your service team matters – not just the first touchpoint. And, companies that streamline the customer journey see 35% higher customer satisfaction.
Use your combined customer service data to get a 360-degree view of your customer journey to learn where service breakdowns exist (so you can fix them). Even just one bad interaction can spoil the rest. It’s like when there’s a half-rotten banana in the fruit bowl.
So, turn to your data early and often to plot important trends. Are you noticing patterns in churning customers? Are your handle times on the rise? How about CSAT scores? Are customers typically silent and suddenly flooding your surveys with complaints? Look for triggers in your data so you can get a grip on the entire customer journey.
Report up to key stakeholders
This one’s big. As a contact center leader, you need buy-in from your VP of Ops and often from your exec team to move customer projects forward. So, be proactive and start sharing important data with your ops leaders in a regular cadence.
Loop your ops leaders in on service gaps and opportunities to improve your service levels. That way if you need a bigger piece of the budget, you’ve built a business case to get the extra cash or headcount you need. And, always tie these numbers back to ROI. Your exec team is always thinking in terms of revenue. So, create a compelling story around revenue, and you’ll get the buy-in you need.
“Numbers in a vacuum – without a story that compels the cost of inaction – aren’t worth much to the C-suite.”
Fill gaps and set goals to improve
Collecting hundreds of data points only to let them sit in your systems buries you in numbers that don’t mean anything to your company. Once you’ve distilled your data points and understand where gaps in your journey exist, FIX. THEM.
If your data tells you that your handle times are sky-high, dig into why. Interview your agents, listen to customer calls, read through chat messages, learn what’s holding your team back from delivering an outstanding experience. Bulk up your coaching and training. Add more self-help resources for your customers. Stock your knowledge base with scripts. Solve the problem. And if you can’t go it alone or you need new technology to reach your goals, surface the information to the right stakeholders and build an action plan to fix it.

Your Step-By-Step Guide to Building Better Customer Experience Strategies
Use data you already have to build actionable strategies for a better customer experience