There’s a quote that many managers — across industries — live by. You may have heard it: You can’t manage what you don’t measure.
There’s no question that benchmarking and measurement are important if you want to improve anything in your contact center, but you still have to be careful about how you approach it.
Some call center benchmarks are a waste of time and resources, at best. But with proper benchmarking, you can determine just how well your operations (and your team) stacks up against your competition.
Here is our run-down of five of the most popular call center benchmarks — click to jump to that section:
What are the two main types of contact center benchmarking?
1. Competitive benchmarking
Competitive benchmarking measures the performance of your contact center against other contact centers and direct competitors.
It can be a good indication of whether or not your call center is performing up to par. Maybe you’re exceeding metrics in some categories, but need a little boost in others. Either way, usually the best way of finding out is by seeing how you match up against other similar businesses.
2. Process benchmarking
Process benchmarking measures the performance of one of your contact center’s business processes across industries.
This is more useful to gain an idea of how your internal business processes are impacted by the nuances of the call center industry
Today we’re going to give you some numbers to help with your competitive benchmarking. It’s worth noting now — as we will again throughout — that these numbers are guidelines only, and not designed to be cut and paste into your contact center reports.
These are meant as a general guide; the best way to improve your call center metrics is to tailor them to the unique needs of your call center or department.
What are some common contact center benchmarks?
We’ve chosen 5 popular call center benchmarks: Service Level, Average Speed to Answer, Abandonment Rate, Call Duration (also known as Average Handle Time), and First Call Resolution, to help you determine whether or not your contact center is performing optimally.
Take a look and see how you stack up!
1. Abandonment Rate
This is the percentage of callers that hang up before their call is answered by an agent. It’s unfortunate that it doesn’t get the attention it deserves, as it’s a great benchmark of call center health.
Abandon rate indicates how accessible you are to your customers. And the less accessible you are, the more bad customer experiences you’ll create, which will impact your bottom line. By not speaking more to your customers, you’re basically leaving money on the table.
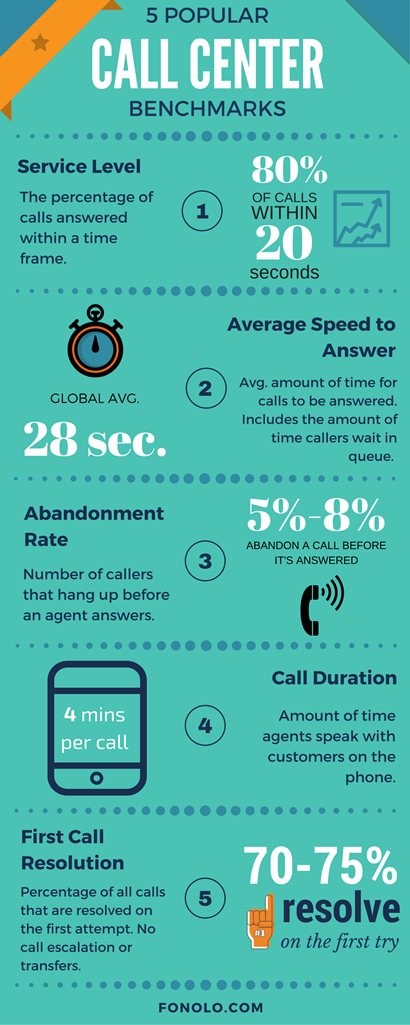
It will vary depending on the industry and the type of customers you support, but if your average abandonment rate is under 5% then you’re doing pretty well.
The less accessible you are, the more bad customer experiences you'll create, and that will impact your bottom line. By not speaking to your customers, you're basically leaving money on the table #cctr #metrics #benchmarks #custserv Click To Tweet- Global Abandonment Rate Benchmark KPI: ~9%
PRO TIP:
If you have an IVR tree that reads out messages to people, it might be causing them to abandon at that time; remember to take this into account when calculating.
2. First Contact Resolution
One of the most important call center benchmarks, First Call Resolution or First Contact Resolution is the percentage of callers whose issues were resolved without them needing to be escalated, transferred to another specialist, or contact again at a later time.
As you can imagine, it’s pretty much impossible to accurately benchmark first call resolution across the contact center industry. And once you start looking at different channels, things become even more complex.
Once you’ve established your current FCR, however, you can be sure that increasing that will improve other KPIs in your contact center too. We’d recommend looking at FCR for channel and inquiry type before looking at ways to improve your skill-based routing.
- Global First Contact Resolution Benchmark KPI: ~70%
3. Service Level
Service level is one of the oldest benchmarks still used in the call center industry.
In truth, there are no industry standards for call center service level, and there shouldn’t be.
We’ve written extensively about the need for service level to be unique to each industry and call center and not an ‘industry standard’ as it was mistakenly held up as. Yet, this figure still exists and is widely adhered to, so it’s worth including.
- Global Service Level Benchmark KPI: 80% of calls answered in 20 seconds
4. Average Call Duration
Call duration is a measurement of the amount of time an agent actually spends with a customer and used to calculate average handle time.
Average Handle Time is a calculation for working out the entirety of the customer’s interaction with you. It includes call duration, the time spent waiting on hold, and the time the agent spends on after-call work. Again, this will vary by industry and by channel and will tend to be much longer for more complicated inquiries.
It helps your contact center estimate how many callers can be handled in an hour, and use that to meet staffing requirements and estimate capacity and efficiency during peak times.
It can be tempting — and many contact center managers have succumbed to this — to try to reduce average call duration to improve efficiency. Do not do this. Many contact centers have found that when they stop using a short call duration as a benchmark for success, many of their other, more revenue-impacting, KPIs like FCR and CSat rapidly increase.
- Global Average Call Duration Benchmark KPI: ~4 minutes

5. Average Speed of Answer
The most important thing to note when using Average Speed of Answer as a call center benchmark is that it does not include the time callers spend navigating your IVR.
ASA simply refers to the time between when the phone rings, and an agent answers. It doesn’t include the time the customer spends going through your IVR tree or waiting on hold.
Although it is gradually getting replaced with benchmarks that better reflects our accessibility to our customers, it’s still useful as a measure of how engaged your agents are.
- Global Average Speed of Answer Benchmark KPI: ~28 seconds
We’ve made up this fun infographic below, which defines and reveals each of the 5 benchmark’s global average, so you can measure against your own contact center’s metrics.
Regardless of the results, we recommend reading the Executive Guide to Improving Call Center Metrics to help you improve each of these benchmarks at any level.

