Customers call, agents resolve their queries, managers supervise, all things seem to run their course…
STOP!
What about the work output, its monitoring, and optimization?
Outbound and inbound customer services should be constantly measured to be improved. Fortunately, there is an enormous amount of Key Performance Indicators (KPIs) to consider.
In this article, we’ve decided to present you 20 call center metrics that will make it easier for you to gain powerful insights into the sales call performance and keep an eye on your customer service efforts.
Inbound call center metrics:
- Inbound Call Volume
- First Call Resolution
- Call Abandonment Rate
- Average Waiting Time
- Occupancy Rate
- Average handling time
- Transfer rate
- Hold time
- Missed phone calls
- Service Level
Outbound call center metrics:
- Outbound Calls per Day
- Contact Rate
- Hit Rate
- Call Efficiency
- Success Rate
- Calls per Hour
- Call Attempts
- Talk Time
- Right Party Contact
- First Call Close
1. Inbound Call Volume
The simplest, but still one of the most important call center metrics.
The majority of inbound call center metrics originate here and can’t be calculated until you count your inbound customer service calls.
You can measure the number of inbound calls daily, weekly, track it over a specific period of time and compare from month to month to see if the total number has changed.
What’s more, you can monitor the inbound phone calls handled by each of your agents i.e. per day. Using this information, you’ll learn how much time they need to respond to one customer query.
It’s worth noting in particular that the inbound call volume has not much value in itself if you ignore its trends and lump calls altogether. The reasons for all incoming phone calls aren’t equal, so you should study them pretty well prior to getting starting with other calculations.
2. First Call Resolution
First call resolution (FCR), perhaps more than any other call center metrics, shows the level of customer service. It can tell you how well your agents deal with challenges since FCR is the number or percentage of issues that are fully resolved on the first interaction with one of your staff members.
How to calculate the FCR rate?
You can calculate first call resolution either for a specific day (today, yesterday, etc.) or averaged over a specific time period. Here is an easy way to do this:
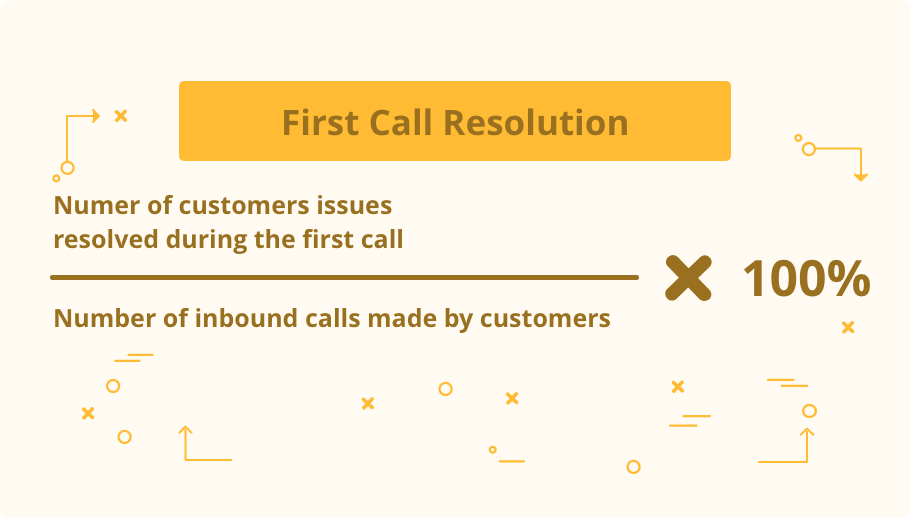
Let’s say, last week your customers contact your agents 50 times because faced the problem uploading an audio file to your app. Fortunately, it turned out that 45 of them simply tried to load files of the wrong format, so your call center heroes resolved that question right away without the need to transfer or follow-up. We don’t have to perform complex mathematical calculations to say that last week’s FCR was 90%.
As you might have already gathered, it’s extremely important to keep your first call resolution rate as high as possible if you seek to ensure your customers have the best-in-class experience.
Your clients don’t call you to discuss the weather forecast for the coming week, they call your support to gain resolution of their query. And your job is to help them as soon as you can.
3. Call Abandonment Rate
Call Abandonment Rate, or CAR, as is usual in the call center industry, refers to the percentage of customers who hang up without waiting for agents to answer.
This call center KPI is one of the most critical call center metrics and is widely used by managers. It affects customer satisfaction, which, in turn, correlates to the success of the call campaign and the business itself.
What does call center abandonment rate calculation look like?
Just like any other rate, the call abandonment rate is always displayed as a percentage and should be calculated in the following way:

It’s very simple, let me give you an example:
Consider today customers called you 150 times (Great, way to go!), 9 of their calls haven’t reached any of your agents as people decided not to wait for the answer and simply hang up:
Call Abandonment Rate = 9/150 x 100% = 6%
It kind of makes you wonder, what exactly led to your customers terminating the call, causing the abandoned calls. Many reasons can be advanced to explain this, ranging from dialing the wrong number by mistake to the caller’s impatience.
Since the reasons vary, you might be interested in the call center abandonment rate industry standard. Although it depends a lot on the industry, callers’ intentions, and a whole bunch of other factors, it’s good to keep your call abandonment rate below 8%.
What’s true is true, you should constantly strive to reduce the number of abandoned calls. But you should always remain objective and understand that a certain percentage of abandoned calls is natural and has the right to exist.
4. Average Waiting Time
As the name implies, Average Waiting Time (AWT) is measured to find out the information on the average time each of your customers has to wait in the call queue until one of the call center agents answers the call.
This call center KPI on a par with other call center metrics indicates how well your customer service team is performing and whether your customers get the service they might expect.
How to calculate Average Waiting Time in the queue?
Average Waiting Time in the queue is often measured in seconds; however, if you take into consideration large periods of time, it’ll be better to consider minutes or even hours.

People – particularly those with urgent questions and queries – hate call queues, and they have a point. That’s why the time they spend waiting in a call queue often overlaps with the call abandonment rate. It’s a sign you should work your hardest to keep the average waiting time as low as possible.
The more clients you have, the more inbound phone calls you get.
Well, there’s good and bad news.
Let’s get into the good stuff first. Your customers are very sociable and always want to talk with you. Sure, cool, now meet promised bad news – average waiting time in the queue takes about 13 hours annually (13 HOURS!). And all that for small talk.
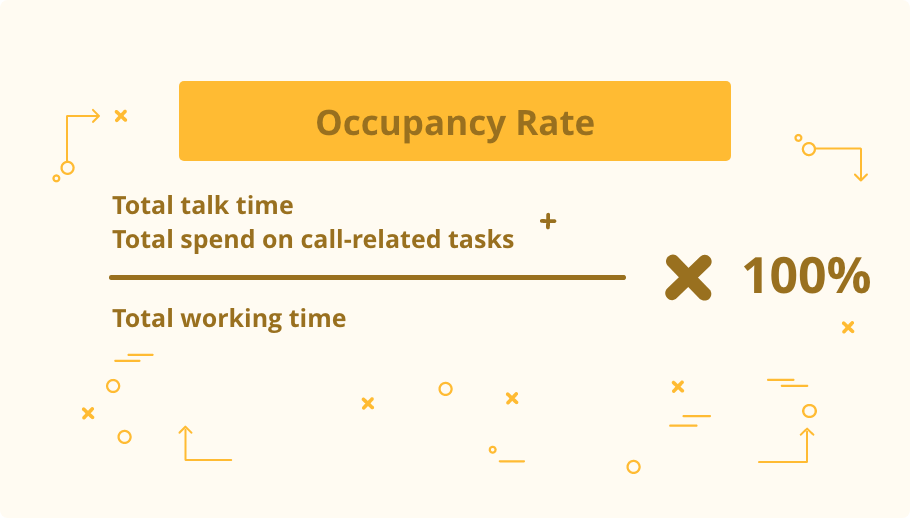
5. Occupancy Rate
Occupancy rate represents the percentage of time your agents spend actually talking (and time spent on the other tasks associated with calls like making notes, checking contact history, etc) from the total amount of time they spend working.
How to calculate the occupancy rate?
To get the most accurate occupancy rate you should check beforehand whether the raw data (including the talk time, time spent on call-related tasks, and working hours) is represented by the same time units (minutes, hours or days).
Additionally, I would like to draw attention to the fact, that this is not the only formula used by call centers worldwide.
If you talk to certain managers, it turns out that some of them don’t include i.e. agent idle time in the total working hours and ignore it when making their calculations.
As a rule, it’s believed that the occupancy rate falling between 70-80% is optimal. However, according to Dan Rickwalder, the occupancy can be tricky enough, and sometimes even 85% would not be sufficient to realize performance targets.
6. Average handling time
Average handling time (AHT) is the average time an agent devotes to handling customers’ calls and resolving their issues. Apart from the time actually talking to the customer, this call center metrics also includes time spent on hold and after-call duties required to fully close the contact (i.e. taking notes, updating contact details in CRM, etc.).
Sales managers often call upon providing customers with a solution as quickly as possible. However, the speed of the conversations doesn’t often overlap with their quality. You got to keep in mind, that you’re there not to respect customers’ time, but to provide effective customer service.
How to calculate average handle time?
The average handle time formula may seem complicated at first glance. But if you make use of a call automation tool the calculation of AHT is no harder than checking call center metrics on the dashboard. It’s calculated as the sum of the total talk time, total hold time, and total after-call work time, divided by the total number of calls handled by the agent.

To greatly improve (not reduce!) the average handling time without affecting customer satisfaction, provide your agents with a helpful tool where they will be able to take notes, view customer details, set status, and more.
7. Transfer rate
One of the call center metrics that reports the percentage of ongoing inbound calls transferred to another better-skilled agent, sales manager, or another department is the Transfer Rate.
The reason for the call transfer could be the lack of the call center agent’s knowledge or authority to make the decision, call routing mistake, or just a client’s request.
Although call transfer is also extremely useful when a customer’s call goes to the wrong agent, according to multiple surveys 89% of customers get frustrated when they need to repeat the same issue to different representatives.
Admit it, when you call customer service with the question, you want to receive the answer as soon as possible. You need assistance, not “queuing” again and again.
That’s why it’s crucial to calculate the transfer rate once you notice that customers’ calls seem to be transferred way too often.
How to calculate the transfer rate?
To calculate the transfer rate you need to know the total number of calls answered by your agents. Once you do, use the following formula:

8. Hold time
The hold time call center metric gives an understanding of the average amount of time (usually expressed in seconds) which the customer spends on hold during the call. At this time an agent can check some notes taken by the colleagues or quickly discuss a customer’s issue with a manager.
However, long hold time can significantly affect the customer experience and satisfaction.
According to the survey conducted by AT&T, a well-known telecommunication company, most callers hang up after an average of 1 minute and 55 seconds of being on hold. Just two minutes and you’re risking losing a lead or existing customer.
How to calculate average hold time?
Easy! Let’s take a look at the simple formula to calculate average hold time:

If you notice an unusually high average hold time, you should think about reducing the amount of time your customers wait.
Start with improving and optimizing your call scripts! Properly built scripts serve as helpful prompts during the conversations. If the calls have been recorded, play them back, as they are something really solid to build upon when updating your scripts.
9. Missed phone calls
Missed phone calls are literally killer for the call center. This KPI has a direct impact on the call center’s efficiency and perspective.
Under competitive conditions missed phone calls always refer to lost leads and customers. You can give very little weight to the individual calls you’ve missed.
However, the situation is starting to look kind of scary once you calculate the amount of missed phone calls over the last year. As Jessica Lalic outlined on the Telux HD VoIP Blog, the average cost of missing a customer call in the UK is £1,230!
Significant potential revenue loss may be one of the top reasons you should consider ways to reduce the amount of missed phone calls. Sure you can expect a callback from that person, or you can simply set up call forwarding and reduce the number of missed calls.
Make sure that your call queues are configured optimally. Call routing ensures you avoid missed phones calls and optimizes your human resource costs by utilizing each agent as efficiently as possible. Call center software can provide you with this power!
10. Service Level
Service level is taken into account almost in every call center around the globe. But there is a catch: its meaning depends on the call center service level formula used to calculate it.
Most often, in call centers Service Level is calculated as the percentage of calls answered by agents within a predetermined amount of time (10 – 20 seconds).
How does a call center service level formula look like?
The most commonly used call center service level formula is the following:

The most widely-used service level target is 80/20, meaning that 80% of all calls get answered within 20 seconds. The long story short – the faster an agent answers an incoming call from a customer, the more he contributes to the higher service level.
However, exploring the topic you might notice that 80/20 is not the service level standard within the industry. There are also other service level targets used, including 60/60, 90/10, and 75/20.
In the second part of the article, we’re going to focus on Outbound call center metrics.
Here, you’ll get to know all the call center metrics tied to prospecting, outbound sales, and cold calling. Improving these KPIs will help you close more calls, become more efficient, and better optimize your work time.
11. Outbound Calls per Day
One of the most basic outbound call center metrics. Knowing the number of outbound calls per day your agents make is as just important as staying informed of the volume of sent emails per campaign.
It gives you a slight overview of the work done, but you need a bit more details to get a clear picture of agents’ and call performance.
How many calls should a salesperson make a day?
Not necessarily each outbound call you make get answered. It happens that no one picks up or agents encounter a voicemail. I don’t have to tell you that, you know full well. It is partly for these reasons that there’s no set number of outbound calls per day that is considered too few, enough or labeled as too many.
However, if you’re putting more trust in numbers, make sure you read Elisa Ciarametaro’s article on How Many Calls Should a Sales Development Representative Make Daily? where she discusses some real-life examples.
While the more increased number of outbound calls per day seems to be a good sign, sometimes, it’s getting nowhere. These calls are just quick calls, your agents are exhausted and fail to engage with prospects.
Sales calls are an age-old numbers game. Just ensure that the quality of outbound calls per day prevailed over their quantity and leads to meaningful engagements.
By the way, Elisa shared the results of her research, and it turned out that agents making 50 outbound calls per day generate the largest number of qualified leads.
12. Contact Rate
You’ve just imported a list of phone numbers, perfected a script, your agents perform outbound calls like crazy one by one – it seems like things couldn’t get any better. Except almost no one has picked up. So contact rate is the very call center KPI that shows the amount of answered calls compared to the call attempts.
How to measure the Contact Rate?
As we’ve mentioned above, the contact rate refers to the percentage of the total number of calls made by the agents to the number of actually performed conversations with leads and clients. You can calculate it in the following way:

We’ve already touched upon the topic of contact rate in our previous posts. Namely, we’ve analyzed over 1,5 million outbound international calls made by our clients in the first quarter of 2018 and found out that local phone numbers drive the contact rate sky high! Actually, you can check the infographic, if you haven’t already.
I agree that it’s quite difficult to get a live person on the phone. And if you find that your contact rate is low, you shouldn’t let yourself be confused. You can and should improve it. Take a look at these 5 effective, time-tested ways to enhance your contact rate, which can help you improve the number of actual live connections you’ll make with your prospects.
As with regard to SaaS start-ups, Steli Efti, CEO of Close.io and the author of The Ultimate Startup Guide To Outbound Sales encourages salespeople to call every sign-up within 5 minutes! He explains that the longer you wait, the worse your chances are of actually getting people on the phone.
13. Hit Rate
When you’re running a call center campaign, it’s important to measure its effectiveness.
It may depend on a large number of factors, including the purpose of the campaign itself, agents’ work experience, their individual skills, knowledge, and more. But still, despite all that, you should learn how the campaign is performing in order to optimize it on the go, meaning maximize the number of call hits while minimizing the number of unsuccessful calls.
Hit Rate is a necessary call center KPI to that end.
This metric measures campaign efficiency and give a precise view of the quality of your contact list. To be more precise, it expresses the percentage of successful calls compared to closed contacts.
While successful calls are self-explanatory, the phrase closed contacts might raise some questions. It is generally believed that contacts that are closed won’t be called again and are no longer processed during a project (campaign).
How to calculate the Hit Rate?
Most call center software has inbuilt analytics dashboards that provide most essential call center metrics, among them Hit Rate. In CrazyCall, you don’t have to look far, as you can easily monitor these call center metrics right from the daily dashboard, both overall and dedicated to a specific project.
If you decide to calculate Hit Rate on your own, take a look at this simplest formula:

Let’s quickly go through the example to show you how to calculate the hit rate for one, specific agent who made 100 outbound calls yesterday.
As a result, he had 50 opportunities for success, meaning that half of the calls he made got answered. He was pretty broken up about it and couldn’t convince each prospect to make a sale. Some asked for a next call, some were not interested at all. Summing up the working day, it turned out that in total he closed 5 deals. To calculate Hit Rate we divide 5 in 45, which equals 0.11 (11%).
14. Call Efficiency
Call efficiency is one of the indispensable call center metrics to build upon when comparing agents’ performance since it refers to the number of successes achieved in an hour.
It’s worth noting, however, that a “success” can be treated differently and its final interpretation depends substantially upon the call center outsourcing contract, if any, and the nature of the call campaign per se.
This broad term can be applied to scheduling demo calls or setting appointments, i.e. But the bar can raise and ”success” can be defined as a closed sale.
How to calculate Call Efficiency?
Simply! Let’s take a look at the most basic formula to calculate call efficiency:

According to CEOs of the major European call centers, for most call campaigns, a 0.4 call efficiency is considered acceptable.
This means it takes approximately 2 and a half hours to achieve one success. This approach to measuring call efficiency call center KPI is a bit reversed but gives a clear view of the work done and its output.
As already mentioned, сall efficiency is measured by the hour, either the agent’s working hours or clock hour. But the first option, in my view, seems to be more accurate.
Why is that?
That is primarily because there’s often no infallible way of checking what your agents are actually doing when they’re not at their desks (in the meeting? or just on a break).
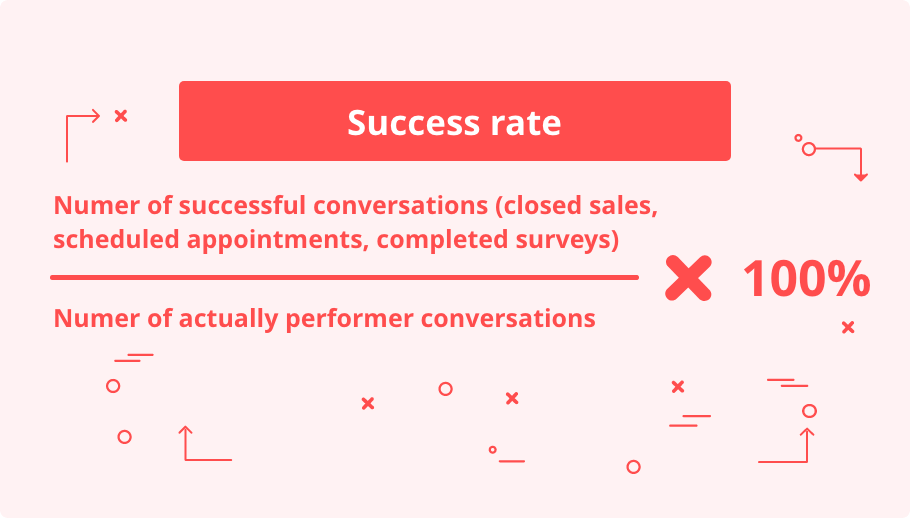
15. Success Rate
The definition of the successful call may vary significantly from one call center to another, from campaign to campaign, and is often covered by an agreement.
Making successful sales calls and calculating a success rate is important not only if success = sale = $. If agents are tasked with scheduling an appointment or carrying out a social survey, this would also imply profit in the long run.
How to measure call Success Rate?
Although the meaning of a successful call can be different in the context of a particular campaign, the call success rate always refers to the calculation of the outbound calls that result in success. It’s also reasonable to consider the percentage of successful calls to the number of actually performed conversations, not the overall number of call attempts.
The more leads your agents to convert into sales, the higher the success rate will be. In most cases, the higher the success rate is, the better.
Remember though that if one of your agents can boast of the success rate that is much higher than other agents have, it means that he is simply looking for an easy sale. Moreover, it’s likely that he quickly drops leads that are not convinced.
16. Calls per Hour
Calls per Hour is a call center KPI that, as its name suggests, shows the number of calls made by the agent in one hour. Knowing the average Calls per Hour lets you easily supervise your agents’ work. It gives you a clearer view of their performance.
Yet, nobody’s ever said how many calls made in one hour is enough. That’s because it depends on how good your contact list is.
It’s worth noting that Calls per Hour correlate closely with other call center metrics such as Contact Rate and Average Talk Time. Knowing all these rates, you’ll be able not only to estimate the number of outbound calls made but their efficiency as well.
How to measure Calls per Hour KPI?
Calls per Hour can be measured in two different ways: for an hour of the agent’s work or for a clock hour. Either way: it’s not the result of a call that matters or even whether or not somebody answered the phone. It’s only the number of times an agent made a call.
If the agent makes 160 phone calls during his 8-hour workday, Calls per Hour will be counted as follows:

17. Call Attempts
Contact attempts KPI refers to the number of outbound calls sales agents make to reach a prospect. Simply speaking, Contact Attempts demonstrate how many times an agent dials the same number to finally get the call answered.
It’s quite common that agents don’t reach the prospect on the first call attempt. And there’s an enormous variety of reasons why the conversation between the agent and lead doesn’t happen: the number might be occupied, a call denied, or not answered at all.
More than that, nowadays agents have to make much more touches per lead and customers and what’s important, make those touches more personalized. So, just don’t give up, it could take even 18 calls to connect with a prospect.
18. Talk Time
Average talk time tracks the time agents actually spent talking to the customers, excluding any kind of pre-call preparation or post-call note-taking.
It is worth mentioning here that calls handled by young agents who have just begun their careers may take longer as they’re still new to your product or service.
How does the average talk time formula look like?
Average talk time is usually an integral part of any dashboard, but you can also calculate this call center KPI manually under the following formula:

According to Gong.io, a conversation intelligence platform, to analyze end-to-end customer communications, the most popular talk times between salespeople and their prospects are 30 minutes and an hour.
Having analyzed more than 30,000 sales calls, it turned out that customers are 12% likelier to answer the first call if it’s scheduled for a half an hour rather than a full one.
19. Right Party Contact
Right party contact is a call center KPI that is pretty similar to a regular Contact Rate, however, here you measure calls answered by a decision-maker compared to the total number of call attempts.
What is the formula of the right party contact rate?
As it was already mentioned, in the world of sales, Right Party Contact Rate is the ratio of outbound calls where agents reach decision-makers compared to the total number of call attempts.

To make your outbound calls more efficient and increase your Right Party Contact, keep testing the times when people who represent the true opportunity answer the phone most often. It’s likely that those mornings of business managers are set aside for planning and attending meetings, so find out when it’s better to reach them out.
According to multiple surveys, the most appropriate time to call is 4:00-5:00 p.m. By calling in the early evenings, you can avoid the gatekeepers’ office hours. Early morning hours also work for sales contacts, but best practices show that this time of day is still controversial and depends on the industry or line of business.
20. First Call Close
First Call Close is one of the most controversial call center metrics within the industry as most salespeople don’t attempt to sell on the first call.
However, it exists and is widely used in B2C.
First Call Close KPI covers the number of call closes (let’s say, sales) on the first call with respect to the total number of calls made by agents. It’s believed that sales reps with high First Call Close rates are bordering on reality and are doing a really fantastic job to sell efficiently.
How to measure the First Call Close rate?
The best way to calculate this call center KPI looks as follows:

Although it usually takes a couple more calls to evaluate sales opportunities and close a sale, you can properly prepare for the sales call and you improve your odds of winning a new customer. Check out your prospect’s social media profiles including LinkedIn and look particularly for familiarities.
Simply speaking: the more things you have in common with your lead, the higher your First Call Close rate will be.
I know you’ve heard that throughout the article, but let me stress that once again.
Using CrazyCall, you don’t have to measure any of the crucial call center metrics on your own. Even more, as for the most important ones, you get a live overview thanks to Interactive Dashboards.
Yet, if you want to adjust every little piece of your call campaigns, you’ll surely enjoy our in-depth downloadable reports that will let you analyze every detail regarding inbound and outbound calls.
Combine that with useful features such as an IVR, mobile app, call scripts, and autodialer and you get a pretty good calling software, right?
Right now, you can try it out with a 14-day free trial during which you’ll get full access to the software, a free phone number, and a few $$$ so you can fully test it out!
Wrap up
There you have it, everything you need to know about the most important inbound and outbound call center metrics.
It’s essential for every manager to know how the ongoing campaign is performing, analyze the call efficiency and customer service efforts of their agents.
The key takeaway here?
Monitoring Key Performance Indicators is crucial for every business. However, even if you have all the important data, being able to interpret it correctly is even more important. Start small, choose a few metrics, and start keeping an eye on them.
Hope we assist you with narrowing down the long list of outbound and inbound KPIs and help you focus on the metrics that really matter.
Happy calling!