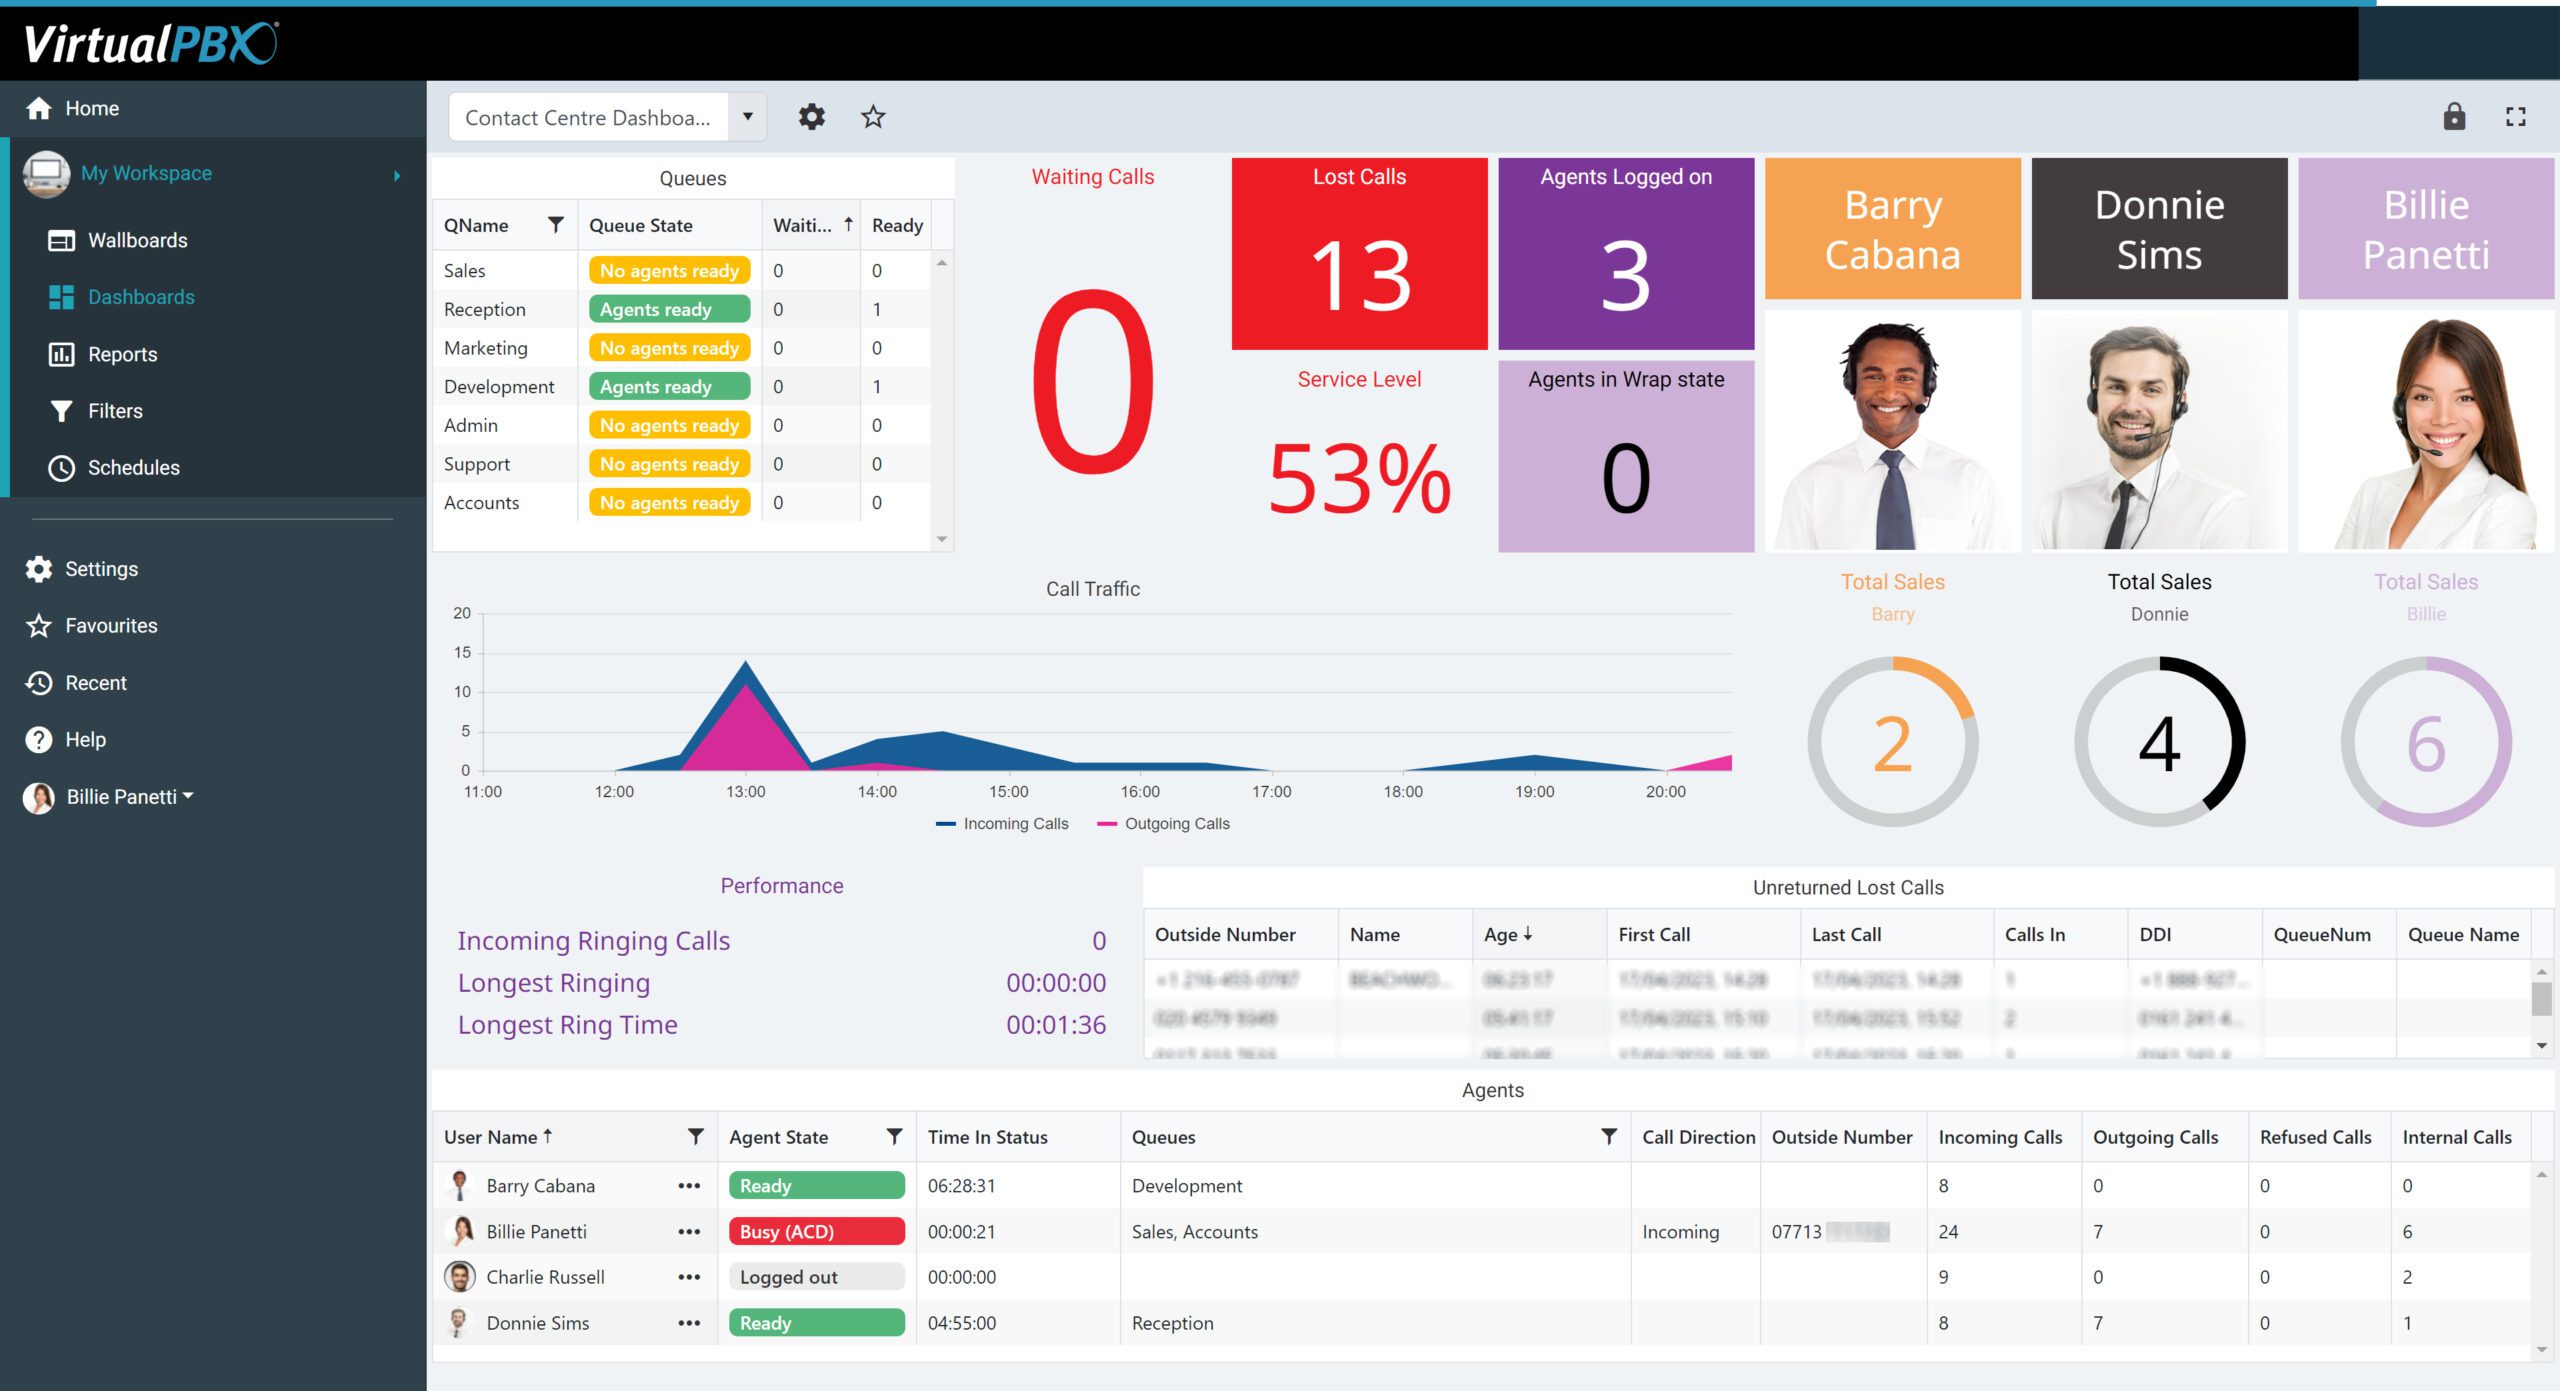
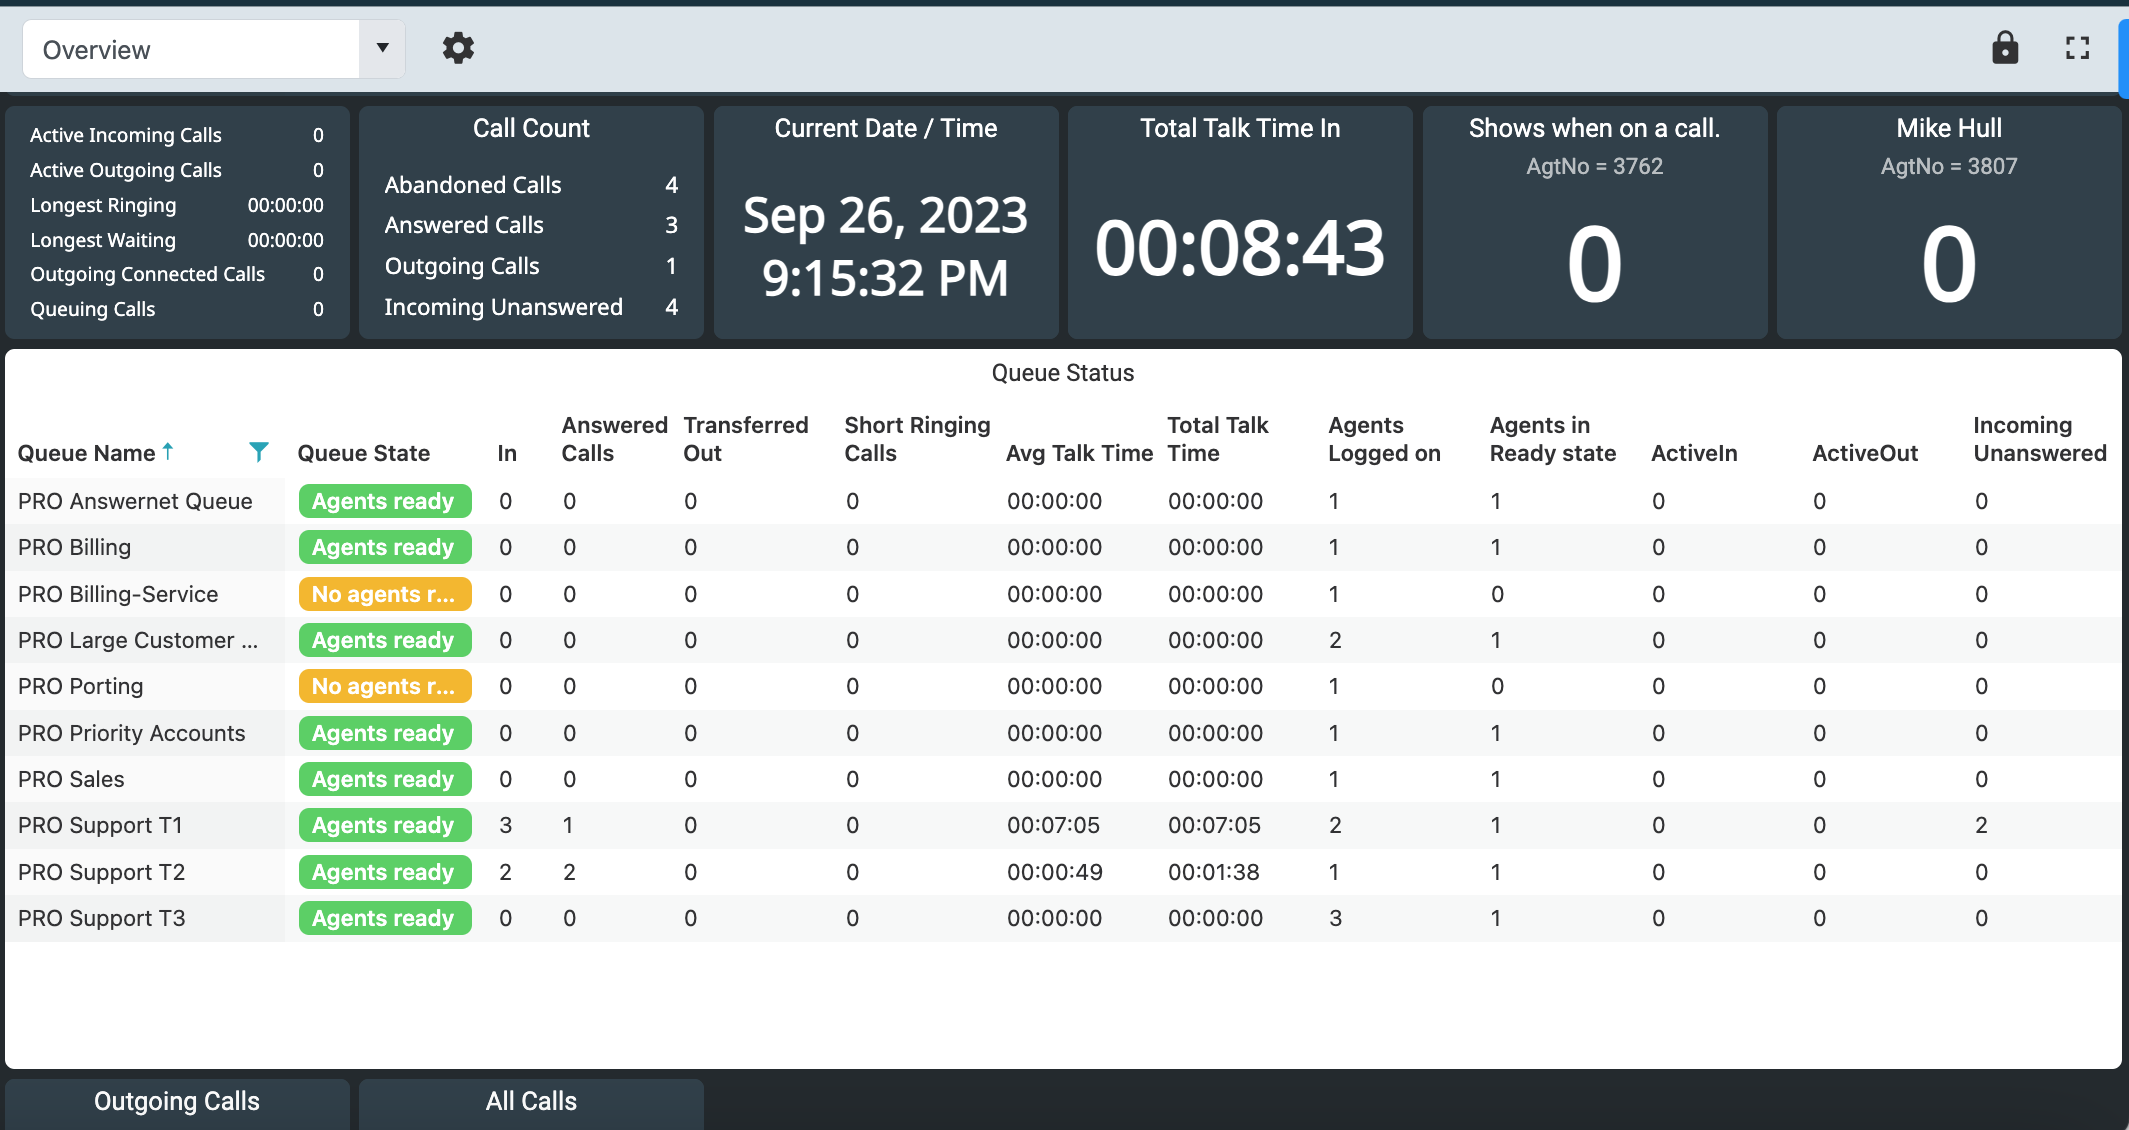
Effective call center management is paramount to ensure customer satisfaction and operational efficiency. Fortunately, advancements in technology have made it easier than ever for call center managers to stay on top of their operations. One such tool, available on the VirtualPBX Premier Plan, is Live Dashboards, which provides call centers with a centralized hub to monitor queues, agent performance, and real-time call statistics. With Live Dashboards, call center managers can make informed decisions to optimize their operations and deliver exceptional service. In this blog post, we will explore three call center dashboard examples that empower managers with the insights they need to excel in this critical role.

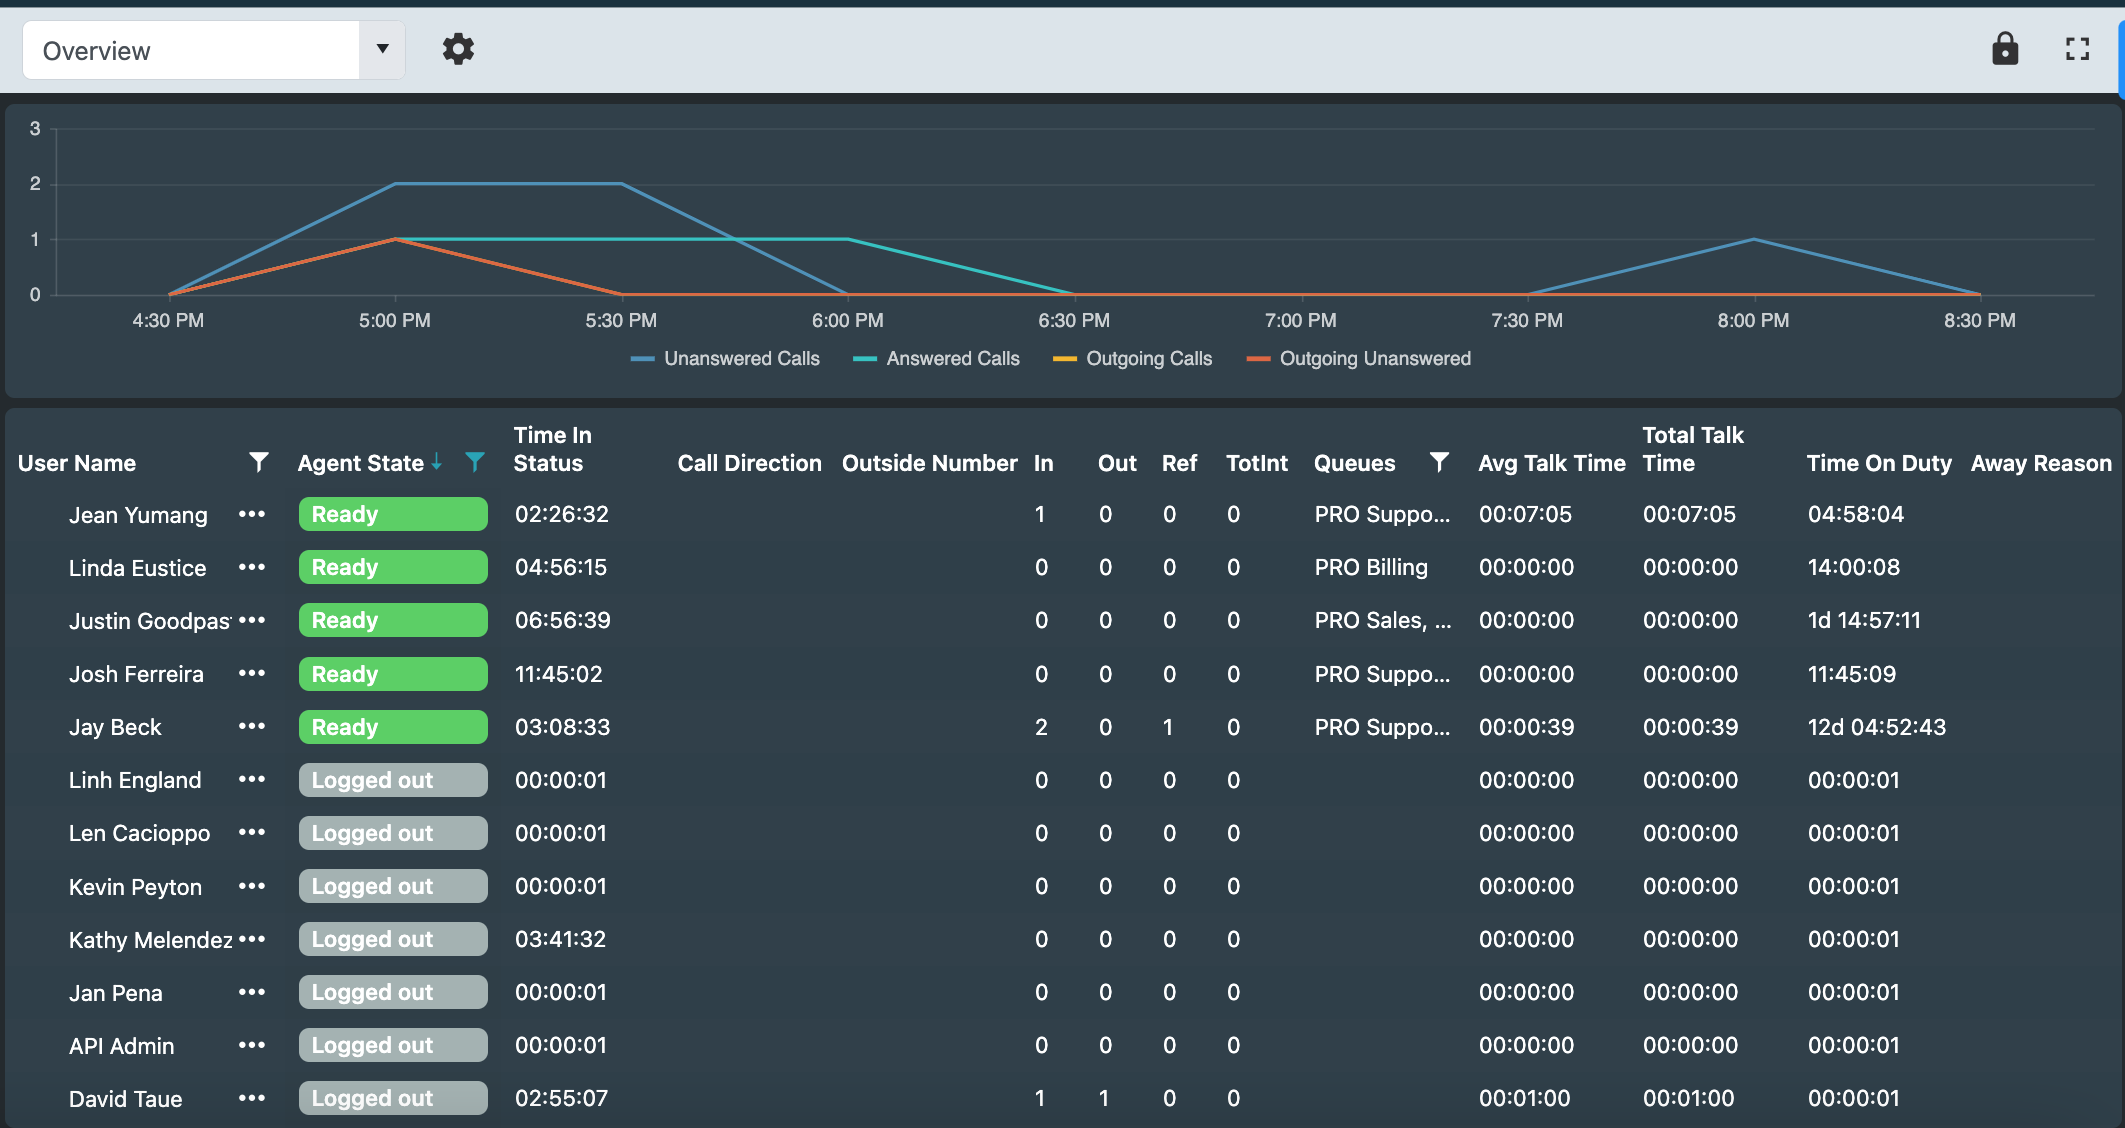
1. Agent Performance Metrics:
Real-Time Dashboards offer a comprehensive overview of agent performance, enabling managers to identify top performers and those who may need additional support. Here are some key metrics that can be tracked:
Call Handling Time: This metric indicates how efficiently agents are resolving customer issues. Managers can set benchmarks and intervene when call times exceed expectations.
First Call Resolution (FCR): FCR is a critical metric that measures an agent’s ability to resolve customer issues in a single interaction. Live Dashboards can provide real-time data on FCR rates, allowing managers to identify training needs.
Agent Availability: Keep track of which agents are currently available, on calls, or away from their desks. This helps in assigning new calls to available agents and optimizing workloads.
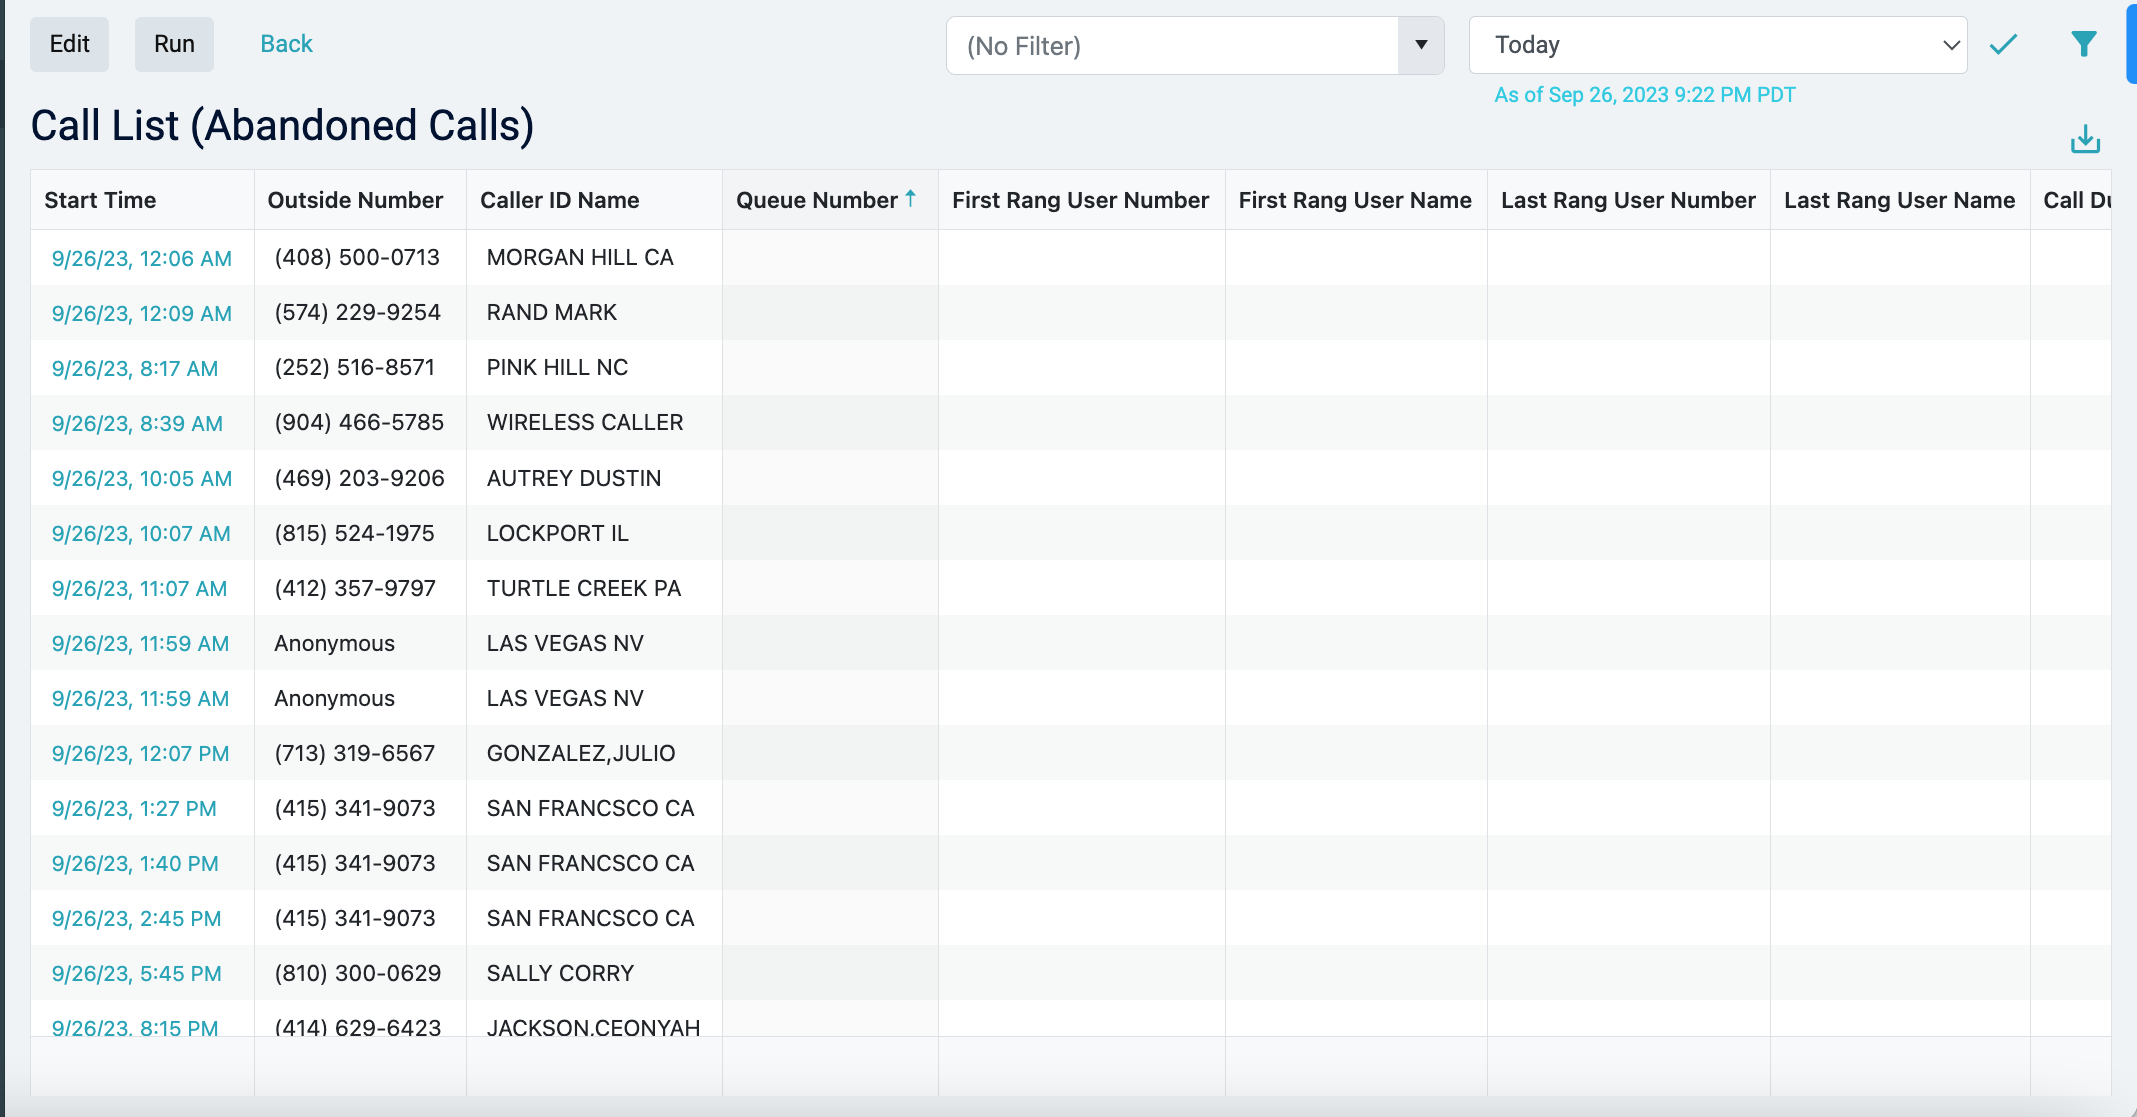
Abandoned Calls: Monitoring abandoned calls allows managers to pinpoint queue bottlenecks or insufficient resources and make the necessary adjustments to reduce abandonment rates.
2. Queue Management:
Efficiently managing call queues is essential to minimize customer wait times and ensure a seamless experience. With Real-Time Dashboards, call center managers can:
Queue Abandonment Rate: Identify trends in queue abandonment, and take proactive measures to reduce abandoned calls by adjusting staffing or improving call handling procedures.
Service Level Adherence: Track the percentage of calls answered within predefined Service Level Agreement (SLA) limits. Adjust staffing levels or optimize agent performance to meet SLAs consistently.
Monitor Queue Status: Get a real-time view of the number of calls in each queue, allowing managers to allocate resources appropriately during peak call times.
3. Call Center Efficiency Metrics:
To run a high-performance call center, managers need to focus on the bigger picture. Live Dashboards provide insights into overall call center efficiency, allowing for strategic decision-making:
Call Volume Trends: Analyze historical call volume data to anticipate peak call times and allocate resources accordingly.
Customer Satisfaction Scores: Integrate customer feedback data into Real-Time Dashboards to gauge the impact of call center operations on customer satisfaction levels.
Agent Workload Balancing: Ensure that call volumes are evenly distributed among agents and teams to prevent overload and burnout.
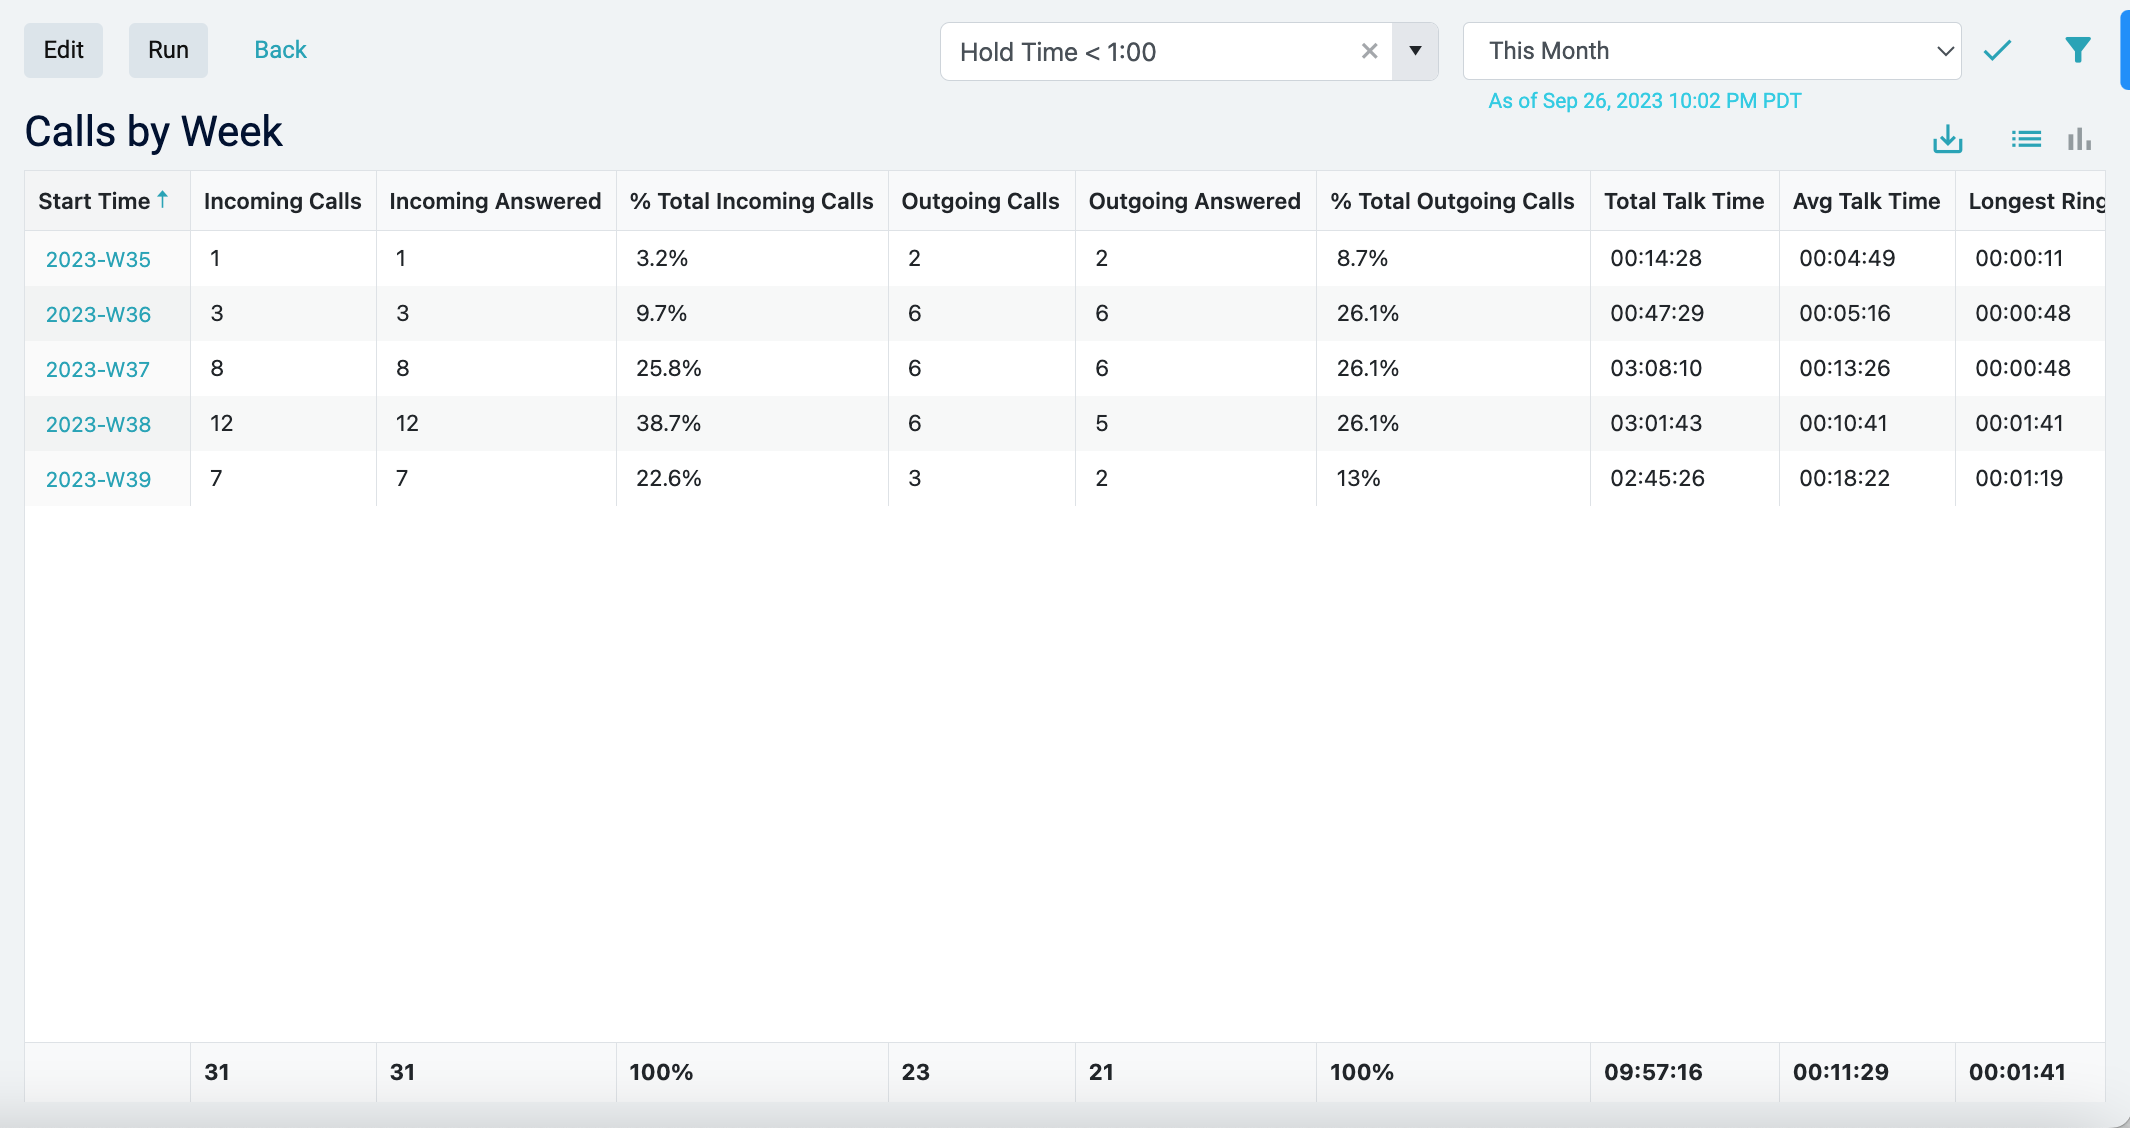
Filtering Data With Real-Time Dashboards
Filtering data with Live Dashboards is a powerful capability that empowers call center managers to hone in on the specific information they need to make informed decisions. Whether it’s sifting through agent performance metrics, queue data, or call center efficiency statistics, Real-Time Dashboards allow users to apply a range of filters to isolate and analyze relevant data subsets. Managers can filter by various parameters such as date and time, agent or team, call types, and Hold Times as in the example below. This level of granularity enables managers to uncover trends, spot outliers, and identify areas that require immediate attention.
Harness The Power Of Live Dashboards With VirtualPBX
In conclusion, call center managers can harness the power of Live Dashboards to enhance their ability to monitor, analyze, and optimize call center operations. With real-time insights at their fingertips, they can make data-driven decisions to improve agent performance, streamline queues, and ultimately provide exceptional customer service. By leveraging these call center dashboard examples, managers can propel their call centers to new heights of efficiency and customer satisfaction, solidifying their reputation as a customer-centric organization.