Forecasting is one of the most important parts of your job as a call centre manager. However, it’s also one of the most difficult things to get right.
Often, there are so many variables at play that it can be extremely difficult to forecast staff requirements. Trying to predict the future is not always easy.
There is no one-size-fits-all method for forecasting call volumes and staffing requirements. However, with the right approach, you’ll be able to make much more accurate forecasts, helping you maximise efficiency while avoiding understaffing as much as possible.
Before we begin: be sure to download our ready-made Excel spreadsheet template to use for the forecasting methods discussed below.
Why forecast staffing requirements?

Managing staff levels is of utmost importance.
If you have too few agents on any given day, you won’t have the capacity to answer calls in a reasonable amount of time, and abandonment rates will skyrocket. However, if you have too many staff, this could lead to resource wastage, if agents are sitting around with no calls to answer, or no people to dial.
Predicting exactly how many agents you need on every single day of the year is next to impossible. Even with the best workforce management plan in place, your service level is always going to better on some days than others.
Therefore, when forecasting staffing requirements, your aim is usually to hit a target range with your key performance indicators.
For example, you might aim to have a service level of between 75/30 and 80/30 – this is the industry benchmark. Meaning, 75-80% of calls are answered within 30 seconds, in terms of an average each month.
Below, we’ll explain more of the actual methodology of call centre forecasting.
How to forecast call volumes

Your ultimate goal is to forecast the number of full-time equivalent agents (FTEs) your contact centre needs, so that you can roster staff on a daily basis. But to do this, you need to estimate how many calls you’re going to receive (or make) on a daily and hourly basis.
First, you need to define the duration of your forecast. Making predictions about staffing needs for the year ahead is helpful for planning long-term resource needs, but might not be as good for weekly rostering. This is because call volumes might spike unexpectedly or staff might call in sick, forcing you to plan staffing needs on a more regular basis.
This is why many contact centres focus on their weekly and monthly forecasts more than their yearly ones. Having this higher level of granularity is really important, because at the end of the day, you’re likely to make contact centre staffing decisions every week or every day, rather than every year.
Note that if you want to make more granular forecasts, you’ll need to make them more regularly. It’s easy to say that the weather will be colder in winter six months ahead of time, but it’s hard to say what the temperature will be on a specific winter’s day, until a week or so beforehand.
Here are some of the challenges you might face when making contract centre forecasts, and how to overcome them.
Finding the right data

To forecast the number of staff you need, there are a number of metrics you need to pay close attention to.
- Call volumes.
- Average handle times. This should include everything from the start of the call to the point when the agent has finished wrapping (their post-call tasks).
- Service level goal.
For outbound contact centres, the data you want to look at is a little bit different. You want to consider:
- Call volumes (the number of calls you will make).
- Average call times (how long an agent typically spends on the phone for a successful contact AND for a failed contact such as a message bank, if not predictive dialling or using answering machine detection).
- Average contact rates (so you can forecast total time spent calling – for both successful contacts and other calls).
In terms of timeframes, you want to use as much historical data as is available, as long as it’s accurate. The more recent, the more useful the data – but we’ll explain how to account for this a bit below.
You will also need to clean the data. If call volumes spiked in a given month because of a new product launch, but this trend is not repeated, you will need to remove this outlier to ensure an accurate forecast.
What if I don’t have this data?

For new contact centres, you might not have a lot of historical data you can use to make forecasts. Or you may be missing this data if using a more basic technology solution.
To overcome this problem, you can:
- Look at the data you have, such as just the previous year, provided you know it is accurate. Then, incorporate your business growth forecasts to account for increasing call volumes in the model.
- Plan based on the number of customers you serve, the type of calls they will make, and an industry-standard average handle time. Think about why a customer would initiate a call – how often is this likely to happen? How complex will their enquiry be, and how long will it take agents to resolve, given their level of experience?
For new contact centres, it’s always advisable to have some leeway when taking your early calls. However, it’s important not to edit the variables in the model when trying to add leeway.
Bumping up your average handle time (for example) can result in a massive change in the number of FTEs forecast.
If adding leeway, keep the model unchanged, and instead add an extra 10-20% to the final number of hours required.
Forecasting outbound call volumes

If you mostly make outbound calls, you’re in luck – it’s often easier to calculate staffing requirements when compared to inbound-only call centres.
You might actually already know your future call volumes. For example, you might receive a consistent number of new records each month, and know that every call takes 2 minutes on average, excluding agent break time. Or you might be able to use a formula such as “calls required = (conversions required)/(conversion rate)”.
In this case, you can skip to forecasting staffing requirements.
However, the number of calls you’re going to be making might be unpredictable or seasonal. For example, if you mostly call inbound leads from your website.
In this case, you can use the method below that inbound call centres use to forecast call volumes.
Forecasting inbound call volumes
![]()
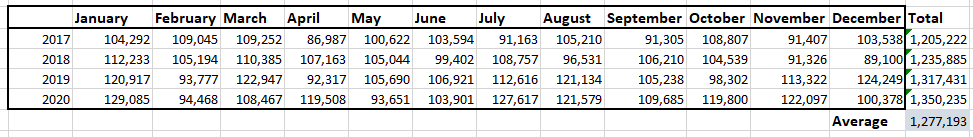
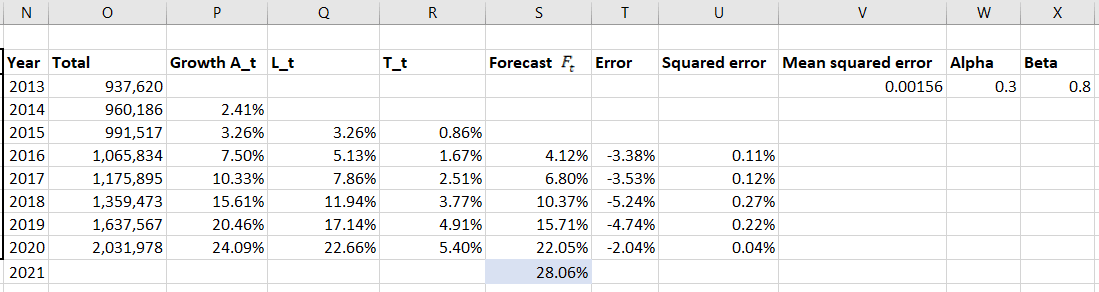
Note: we’ve used yearly/monthly data in the examples throughout this post, but the same method works with daily/hourly data as well.
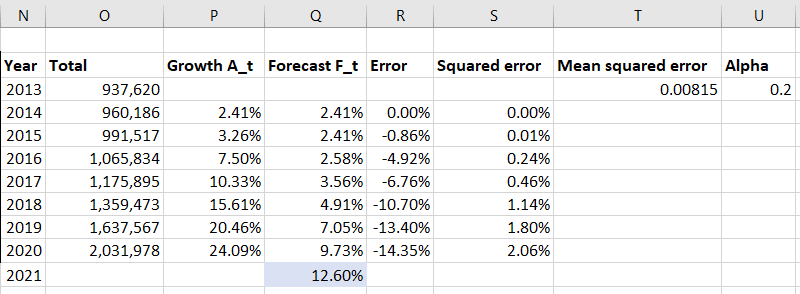
The first thing you want to do is grab your historical data, and calculate period-by-period growth rates in call volumes. This helps to avoid some of the major problems with using simple averages.
For example, in this contact centre, call volumes are growing each period. If we take a simple average, the growth is not accounted for, and the forecast is likely too low.
If, on the other hand, we find the annual growth rate, we can then find average growth by period, and use this to predict growth for 2021.
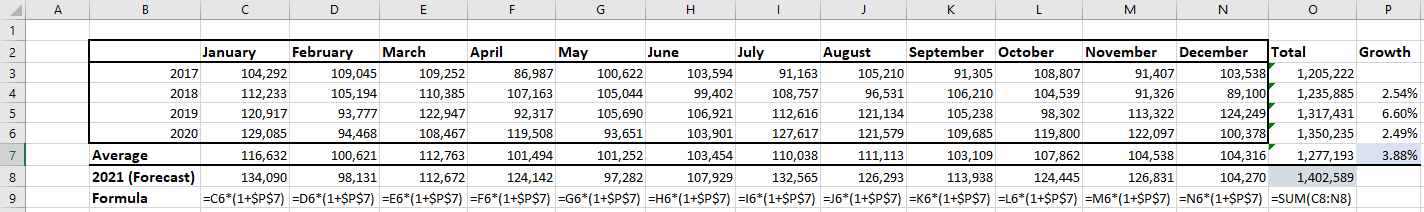
Cell P7 is an arithmetic average of cells P4:P6, which is then used as a predicted growth rate for each month.
However, there are some problems with this technique:
- It applies equal weighting to each period’s performance, when in reality the most recent performance matters most.
- It fails to account for seasonality, product launches, and other factors that could increase call volumes.
Exponential smoothing

To solve the first problem with the aforementioned method, we can use a technique known as exponential smoothing.
Exponential smoothing is a forecasting method that assigns increasing weightings to data in the recent past when compared to the distant past. This helps to calculate a more relevant average based on more recent data.
The formula for exponential smoothing is:
![]()
Where:
 = the next period’s forecast value.
- = the smoothing constant: . This defines to what extent the formula relies on current data versus older data. The higher is, the greater the emphasis placed on recent data. To find the right , best practice is to use whichever value produces the lowest “mean squared error”, or the lowest average difference between forecast and actual values. You can find the mean squared error by making forecasts for previous known values. An alpha of 0.2 or 0.3 is normally used.
- = the actual value in the current period.
- = the forecast value in the current period.
Here is an example of exponential smoothing in action.
Download our exponential smoothing spreadsheet to see how this works up-close:
Note that we assume that in 2014 the forecast equals the actual value, because no forecast value is given.
Changing alpha will influence the mean squared error.
The problem with exponential smoothing is it fails to account for trends in data. As we can see, it predicts that 2021 will see a 12.60% increase in calls, despite this being lower than each of the previous three periods (in column P). This is fine if your growth rate stays roughly the same year-on-year, but will result in poor results for growing contact centres.
Double exponential smoothing helps to solve this problem.
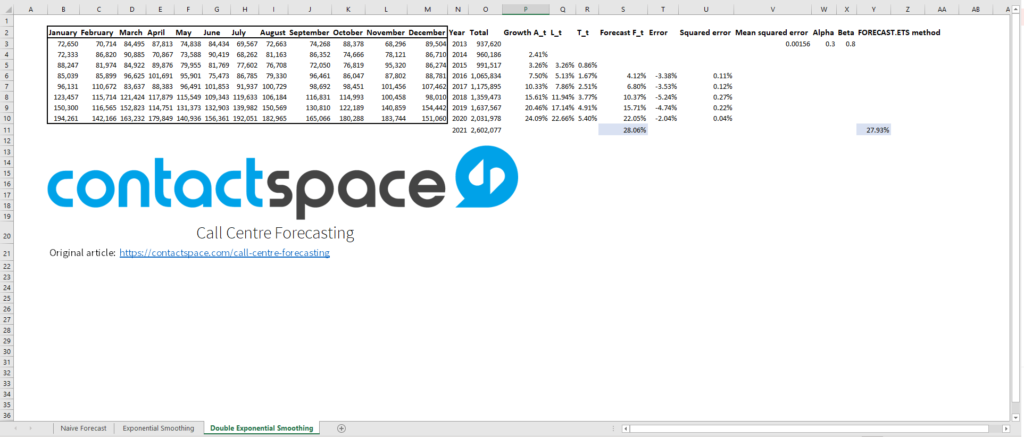
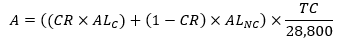
Double exponential smoothing
As the name suggests, double exponential smoothing applies a second exponential filter to the data to account for trends.
Essentially, we have a “level” component to the equation, and a “trend” component to the equation.
![]()
Where:
Don’t worry if these equations don’t make sense. Our Excel spreadsheet helps to show how double exponential smoothing works.
Download it with this form:
In ![]() , we are doing something similar to single exponential smoothing. We are assigning a portion of the forecast to the previous actual value and another portion to the trend value using alpha.
, we are doing something similar to single exponential smoothing. We are assigning a portion of the forecast to the previous actual value and another portion to the trend value using alpha.
However, in ![]() , we introduce another constant,
, we introduce another constant, ![]() .
.
While alpha ![]() denotes the data smoothing factor, beta
denotes the data smoothing factor, beta ![]() is the trend smoothing factor. Both must be between 0 and 1.
is the trend smoothing factor. Both must be between 0 and 1.
As we mentioned above, 0.2 to 0.3 are typical alpha values. Beta values can be higher – typically in the range of 0.7 to 0.8.
Here’s how double exponential smoothing works in practice.
A few things to note:
- Double exponential smoothing takes a little while to get going. The more data you have, the better, so that the function can “learn” about the trend. This is why the first four forecasts we significantly lower than the corresponding actual value.
- The mean squared error is 80% lower than when using single exponential smoothing. The forecast keeps up with the growth rate a lot better.
- A similar result can be achieved with =FORECAST.ETS in Excel. However, this function does not allow you to define alpha/beta factors.
Accounting for seasonality

Despite accounting for trends, the double exponential method still fails to account for seasonality.
If you normally see a massive spike in calls around Christmas for example, you’ll need to account for this.
There does exist something called triple exponential smoothing which adds a third coefficient, known as gamma ![]() .
.
The process is similar to the jump between single and double exponential smoothing, but this third level of smoothing is much more complex.
A quicker way is to simply compare call volumes by year using double exponential smoothing, but compare actual and forecast volumes for each individual month.
For example:
- February 2018: 25,000 calls.
- February 2019: 26,450 calls.
- February 2020: 27,950 calls.
How to forecast staffing needs

At this point, you should have a good idea of how many calls you’re going to be making or taking in future periods. Now you need to determine how many staff you need.
Forecasting outbound staffing needs
Once again, when making outbound calls, forecasting is a little easier. You just need to know how many calls you’re going to be making – either by liaising with your customers (if you’re an agency for example) or by using the forecast method detailed above.
You also need to know some basic details about your typical calling results. In general, it’s fine to use historical averages for these inputs, provided there is nothing to suggest that these values are likely to change for future calling. For example, upgrading your calling solution, improving data quality, or helping agents have better conversations.
- Average length of a connected call in seconds
- Average length of a non-connected call in seconds
- Connect rate
- Total calls per day
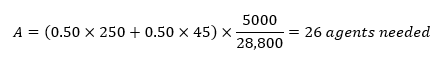
To find the number of agents (A) you need per day, assuming an 8-hour day:
What this formula does:
- Finds the number of seconds spent on the average call, given how long you spend on connected and non-connected calls, and how often you get a connected call.
- Multiplies this by the number of calls per day to find the total number of seconds calling per day.
- Divides this by 28,800 (the number of seconds in 8 hours) to find the total number of agent days worked per day, assuming an 8-hour workday. This the number of full-time equivalent agents you need.
For example:
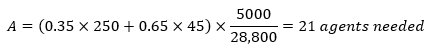
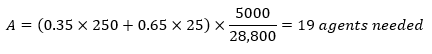
For outbound teams, this formula really demonstrates the benefits that can be had from improving efficiency. For example, if you can cut down the amount of time it takes to complete a non-connected call from 45 seconds to 25 seconds, this becomes:
It is possible to expand this formula to make it more granular. For example, different initiatives may see different results in terms of talk-time and how long it takes to complete a call. In this case, you can simply use a weighted average based on the proportion of calls in each initiative.
Beware that this formula fails to account for the importance of contact and conversion rates. Say your contact rate rises from 35% to 50%:
You might not need 7 more agents, because you’re achieving better results. Instead, you could cut down the number of calls you make per day, and get the same or (more) conversions in fewer calls.
Here at contactSPACE, we help a number of outbound contact centre teams massively improve their efficiency and achieve better results in fewer calls. With contactSPACE CallGuides, you can build the perfect workflow for each call, ensuring agents don’t waste a single second when making and wrapping calls.
Plus, with contactSPACE Intelligent Outbound, many of our customers have seen their contact rates rise by as much as 50% – by making the right contact, at the right moment – and avoiding overdialling.
Forecasting inbound staffing needs
![]()
When calculating inbound contact centre staffing requirements, you have another factor to consider – your target service level.
How do you account for how quickly you want to answer the phone when forecasting staff requirements?
Fortunately, there’s something called an Erlang C formula that you can use to solve this problem.
This is the Erlang C formula:
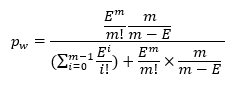
m is the number of agents. Since finding m requires complex goal-seeking, you’ll need a macro to set it up in Excel.
With an Erlang C calculator such as this one, you simply input your average handle time, desired service level, incoming call volumes, and shrinkage, and you’ll find the number of agents you need for your call centre.
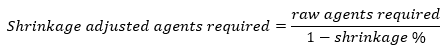
What about shrinkage?

It’s important to note that the above formulas do not account for shrinkage.
For example, with the outbound formula, your average call time metric should include:
- Previewing
- Dialling
- Talking
- Wrapping
It does not include:
- Break time
- Sick leave
- Training
- Meetings
Shrinkage is expressed as a percentage figure – the proportion of agent time spent these activities not related directly to calling.
For example, there are 37.5 * 4 = 150 working hours in a month, and you estimate that on average:
- 8 hours is spent on training
- 8 hours is spent on coaching
- 8 hours is spent on meetings
- 8 hours is spent on miscellaneous activities
Then ![]()
Accounting for shrinkage is the same as accounting for leeway, as we discussed above. You do not want to edit the variables in the model, or this can massively skew your forecasts.
Instead, adjust the final value, as shown:
Conclusion
It’s possible to be extremely advanced with your contact centre forecasting. You can do things like:
- What-if analysis: if you were understaffed by a certain amount, how would this affect the number of calls you make per month/your service level?
- Building extremely complex Excel macros, to help automate some of the process.
- Triple exponential forecasting, as we touched on above.
At the end of the day, you want to make forecasting as easy as possible. You don’t necessarily need to use a complex forecasting method – you just need to find a method that works for you.
To do this, keep track of the error – the difference between the forecasts you’re making and the actual values. Having some small difference is normal, but you really want to minimise your error value. This should be the main goal as you continually optimise your forecasts.