They call it a north star metric for a reason, and if CSAT is indeed your north star, it should never stray too far from sight.
Apart from customer satisfaction, there are plenty of other KPIs and metrics your support team is probably measuring today.
You have your average response times, your first contact resolutions, SLAs, resolution times….just name it. In fact it can be very easy to get overwhelmed by the sheer amount of KPIs you’re measuring.
As I once heard by someone smart (I wish I could remember who it was), KPI stands for Key Performance Indicator, and if you’re measuring more than 5 of these, then they are probably not that K.
To combat this, the methodology of the so-called “North star metric” started to gain prominence amongst Silicon Valley companies. Whatever metric you decide to focus on, it should be (as the North Star itself is) visible. So let’s take a look at how visible you can make your customer satisfaction data within Zendesk, using several different methods.
Viewing CSAT using Zendesk Support
First let’s take a look at what can you achieve using only Zendesk Support. For this part of this post we’re going to assume you’re using Zendesk’s built-in CSAT solution, but we’ll talk about using a dedicated 3rd party CSAT tool later on. If you’re not using either at the moment and are unsure which way to go, check out our “Pros and Cons of Using the Built-in Zendesk CSAT Solution” post.
Every agent can see their CSAT data in their Zendesk Support dashboard. Here they can see the number of good and bad tickets for the last week as well as their overall CSAT over the last 60 days (including the current day).

The good
As it usually is with native solutions, the good thing is there is next to no setup required. As soon as you enable Zendesk’s CSAT in your account and start collecting ratings, agents will be able to see this report in their dashboard.
The view is also very simple and doesn’t flood the agents with unnecessary information, which can also be considered a plus.
The bad
If I were to say it with one word, it would be “limited”. If I were to use two words, the other one would be “very”.
Agents can only see their statistics and there is no way for them to see statistics of others. They are also limited to seeing only the data for the past week (or 60 days in terms of overall account satisfaction).
Another thing missing is context. Proliferated marketing saying goes like this “Content is King, but context is Queen”, and this holds true when discussing in feedback as well. While Support’s dashboard shows you WHAT kind of feedback you’ve got, there is no easy way to drill down and see WHERE it came from.
Viewing CSAT using Zendesk Explore
Another option to use Zendesk’s analytics & reporting tool – Zendesk Explore. Using it, you can find a Satisfaction tab within the Zendesk Support dashboard inside of the product tray in Zendesk Explore. Sounds complicated? A little, yes.
This dashboard provides you with a better overview of satisfaction across your entire Zendesk account. This view is more suited for managers, and since it needs to be shared by an Explore administrator first, most agents probably won’t have access to it.
In Explore you can view your overall CSAT score for the account, number of good and bad tickets, bad to good ratio as well as response rate of your CSAT survey.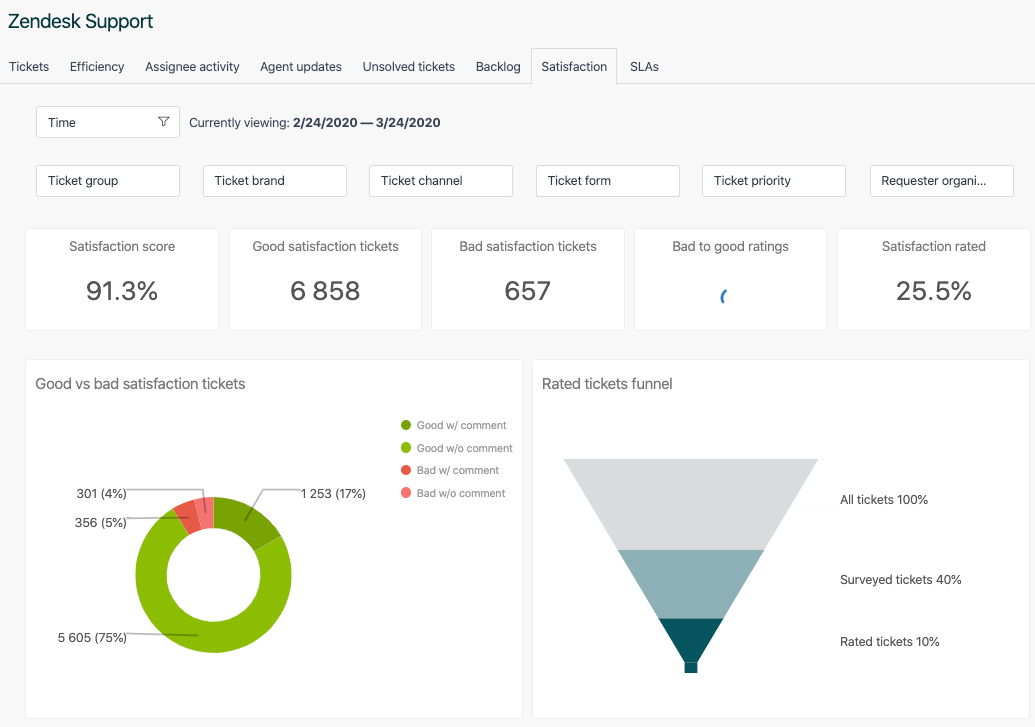
Apart from this, you can also see CSAT displayed in time, as well as grouped by attributes, such as channels and languages.
The good
The entire dashboard is much more robust and informative, than the basic dashboard provided by Support’s insights. Explore provides admins and managers with a lot of information at a glance in an organized fashion.
Filtering and grouping CSAT by attributes allows you to analyze performance of different languages, channels and other parameters to pinpoint where you need to improve.
Charts are easy to read and enable you to compare and predict your performance.
The bad
First of all the data displayed in Explore’s dashboard is limited to the last year. Want to see older data? Too bad.
The fact that it’s a totally separate product used to view data from Support doesn’t exactly scream intuitive. You get the basic (Lite) plan of Zendesk Export for free if you’re on Zendesk Professional or Enterprise plan (which you need to be to use their CSAT), however, if you’d like to customize your dashboards as well as some other advanced features, Explore is going to cost you an additional $9 per agent.
Lastly, even though great for high-level analysis, Explore still lacks the ability to drill down into specific cases, to see the feedback in context to its respective ticket.
Viewing CSAT using Zendesk Satisfaction Console
Now unlike previous options, Zendesk Satisfaction is less of a dashboard and more of a deep dive tool. It’s an app found in the marketplace, that allows you to access, search, and analyze CSAT results. You can filter cases, drill down to individual tickets as well as export results.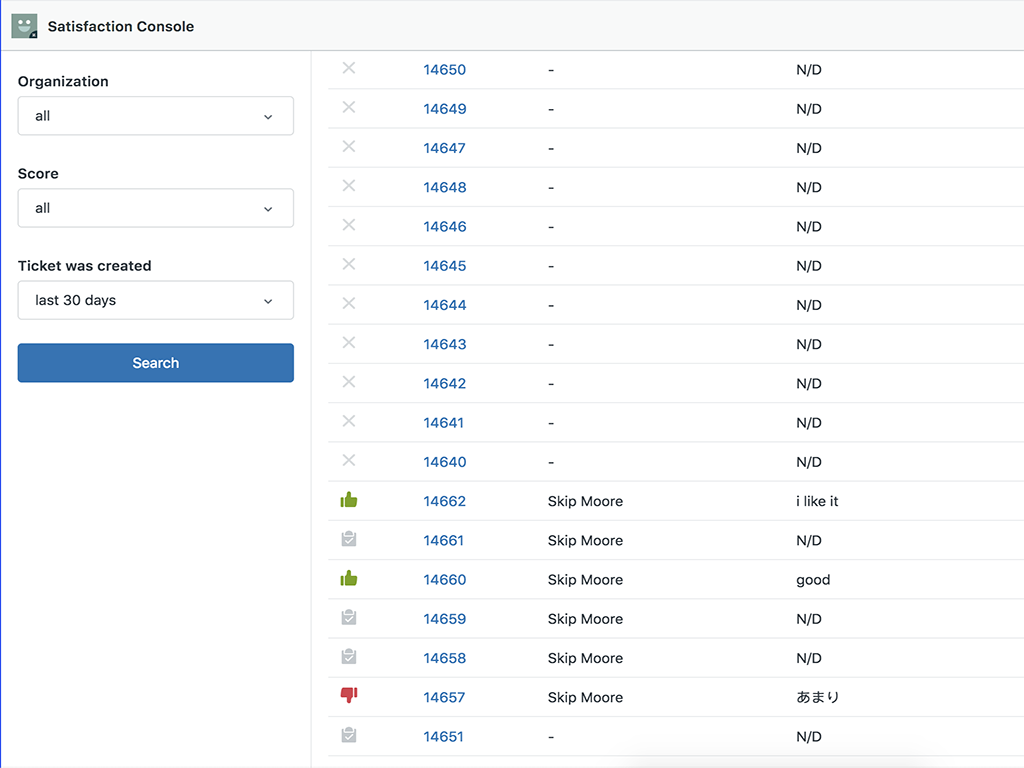
The good
Using Satisfaction Console finally allows you to see feedback in context to customer conversation.
The bad
First of all, it’s yet another tool you need to rely on, to get a complex view of your customer satisfaction.
And it’s not a free tool either. Unlike Explore which at least comes with a basic version available to everyone using Zendesk, if you want to use Zendesk’s Satisfaction Console, it’s going to cost you $1 per agent/month.
Viewing CSAT using a 3rd party solution
We’ve just introduced 3 different tools made by Zendesk, that you can use to view your CSAT data. So why should you consider using a 3rd party solution? Apart from the obvious benefits like greater customizability, and more survey options, you’ll get a more holistic approach to viewing your data.
Instead of a combination of using Zendesk Support, Zendesk Explore and Zendesk Satisfaction Console app, you’ll be able to view all your data in a single environment designed to show you just that and not 100 other things you’re not interested in.
Viewing CSAT using Nicereply
Let’s delve into specifics and take a look how you can use Nicereply to view your CSAT data collected from Zendesk tickets.
Using the CSAT Overview screen you can see your CSAT score, average rating value as well as number of ratings collected. Below it you’ll find handy charts of how your CSAT and number of responses change in time. You can also see a histogram of your ratings, as well as number of surveys sent, their open rate and their response rate.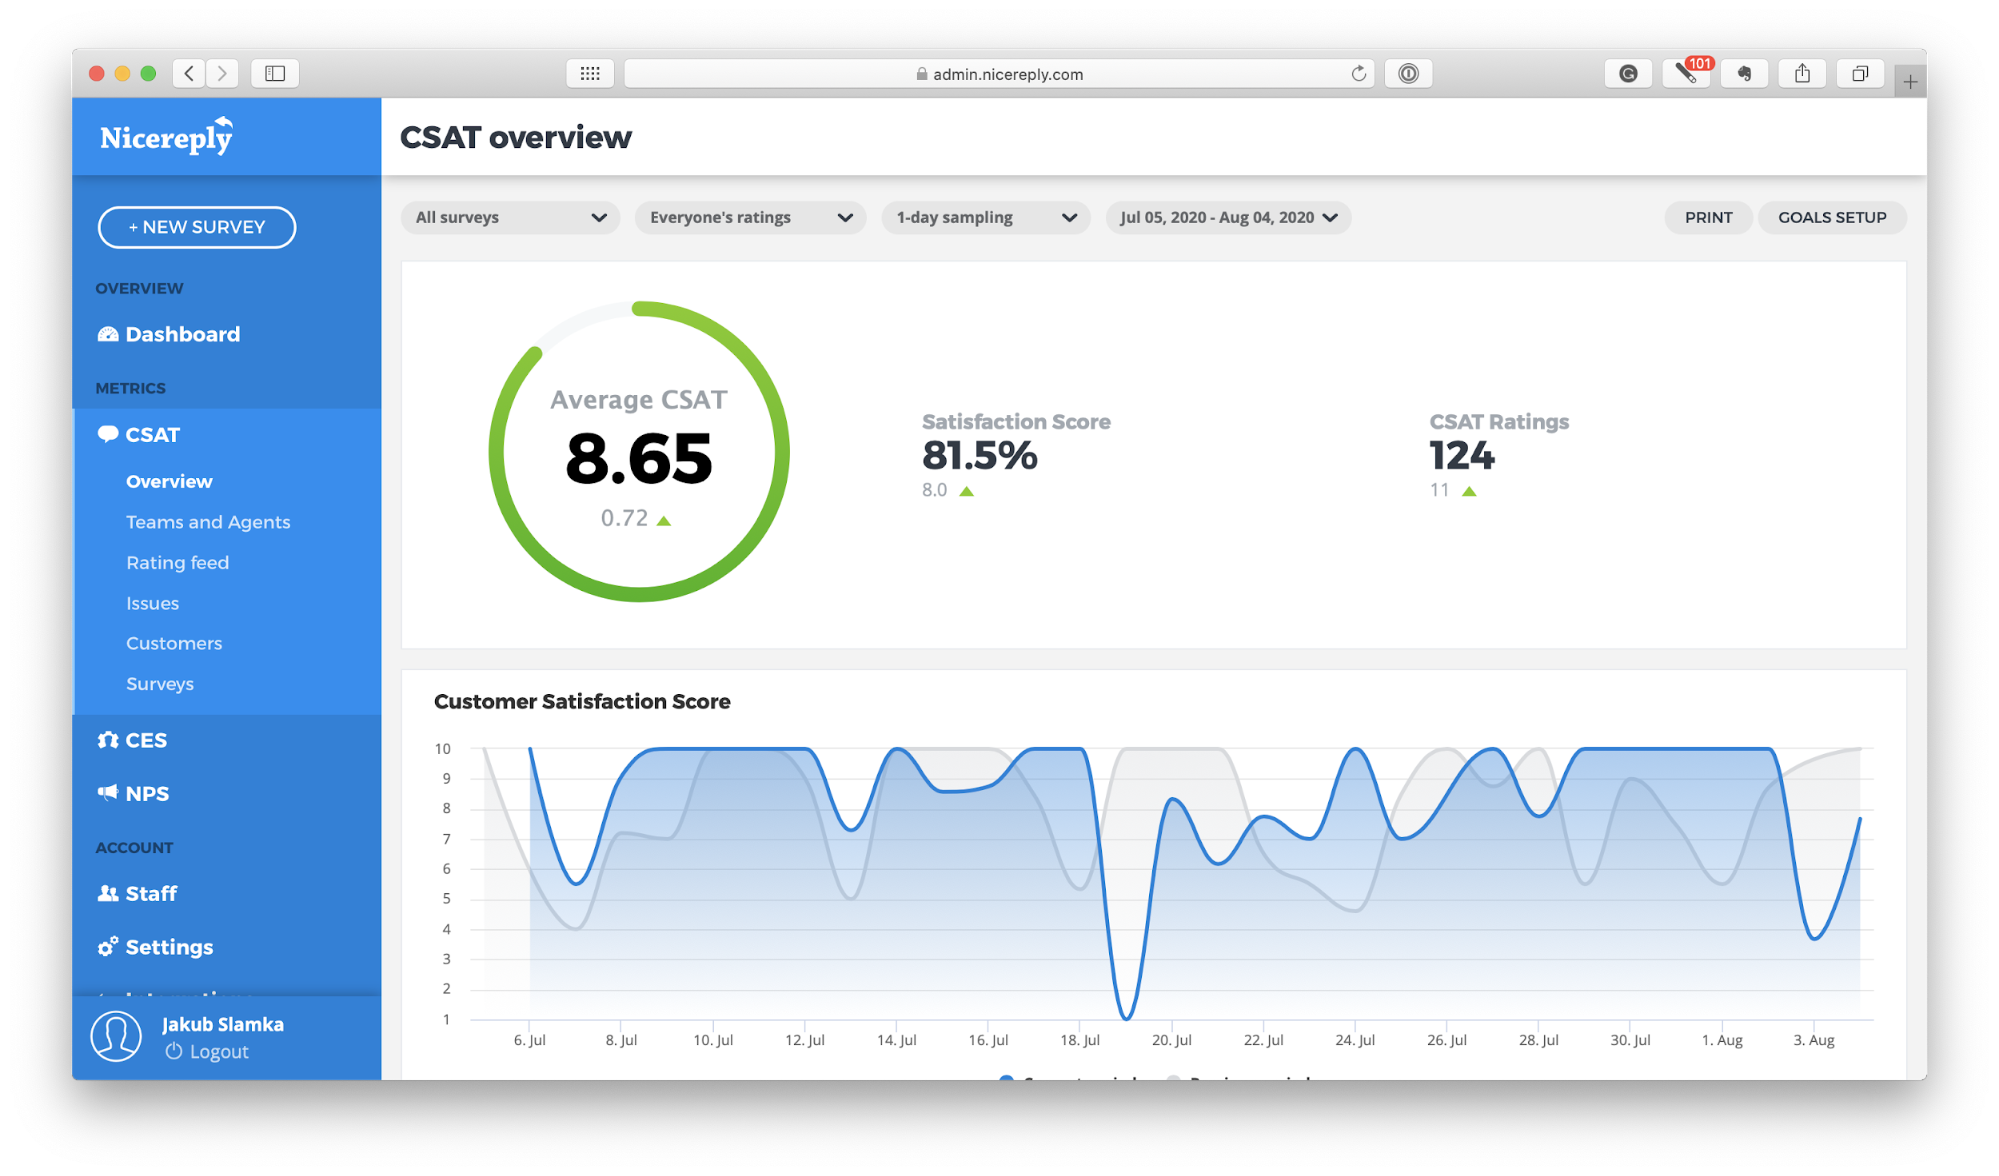
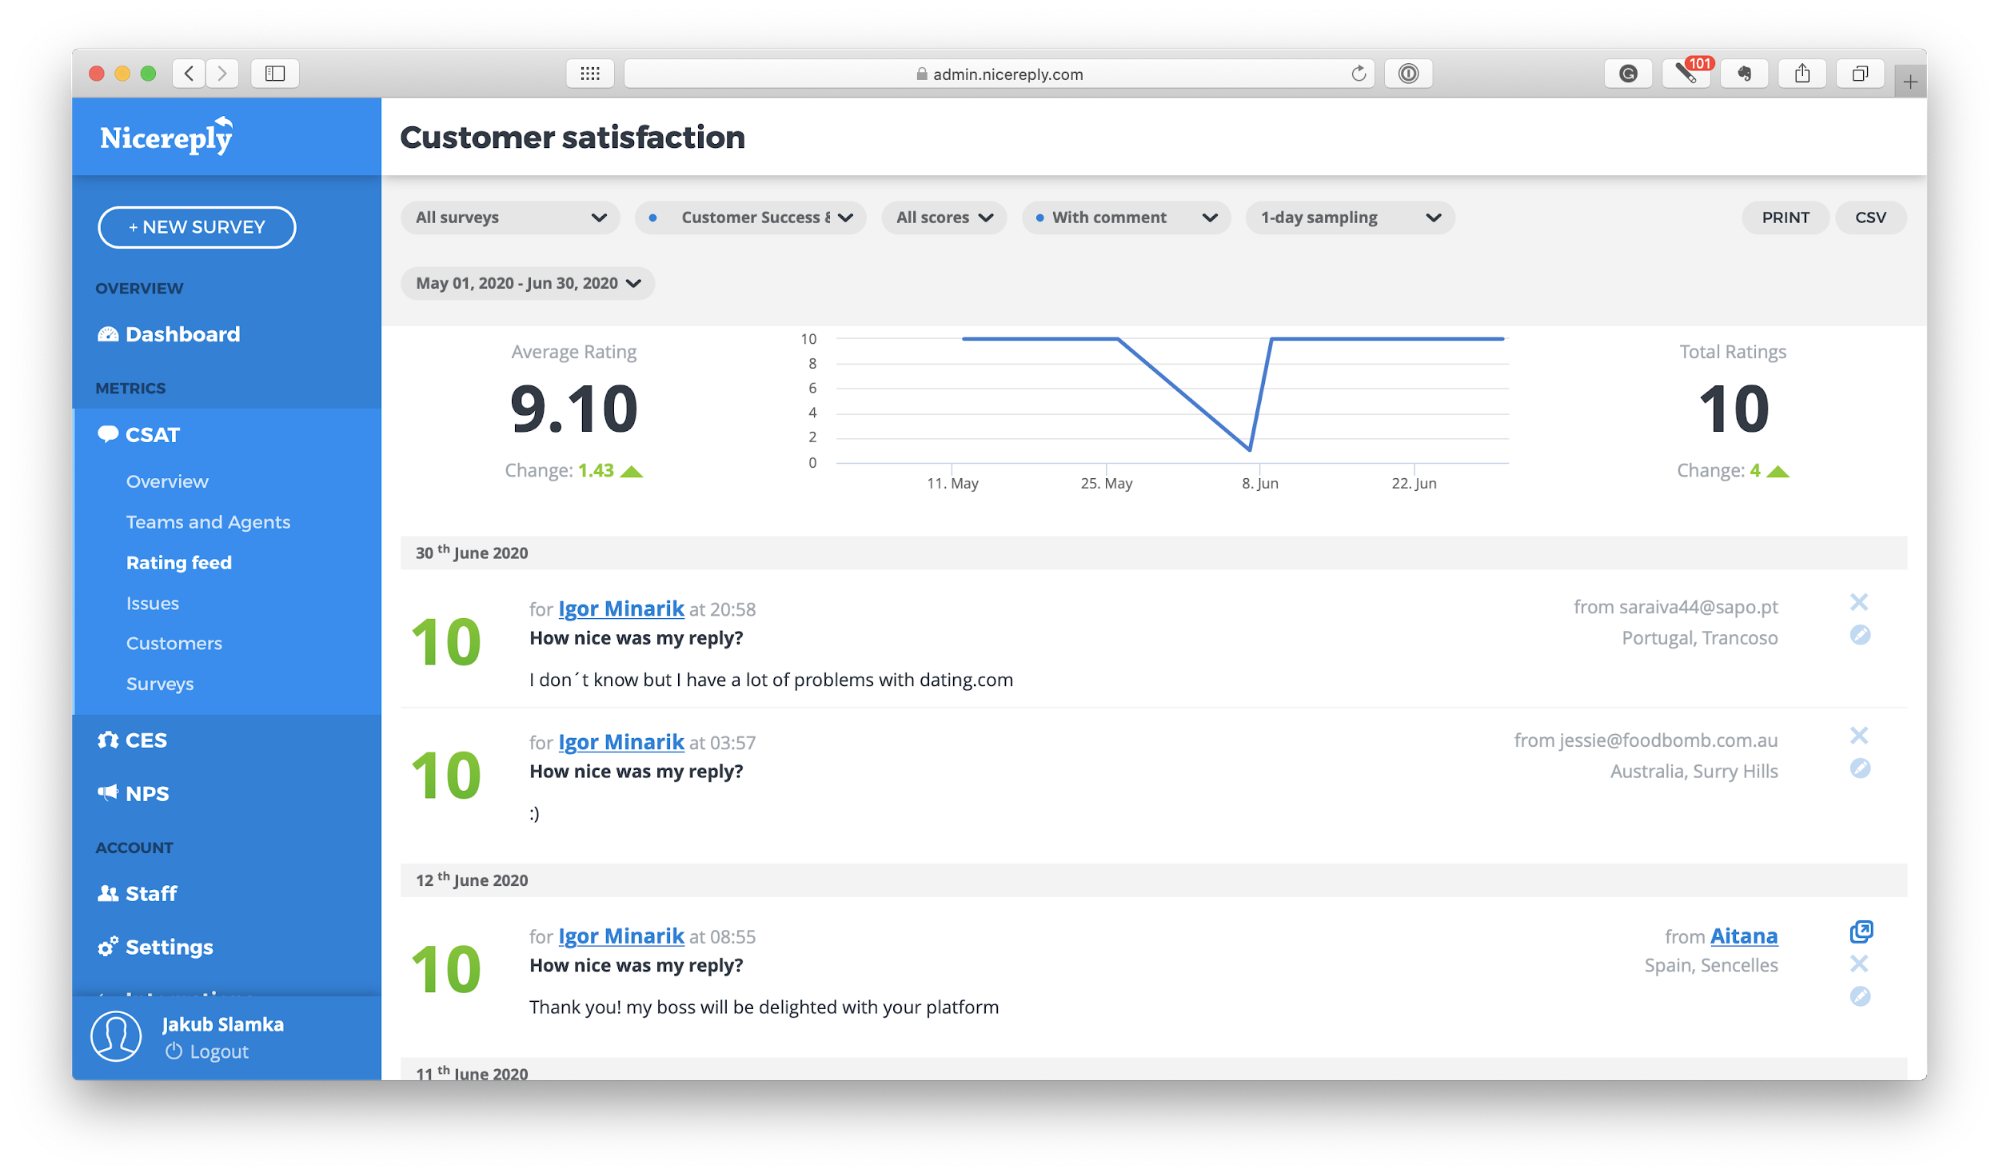
Not only can you see the stats, you can also see the feedback in context to rated tickets. On the Rating feed screen you’ll find a real time updated dashboard of all your feedback, with links to their respective Zendesk tickets.
You can also compare your agents, or teams to see which agents are your stars and who may need some additional training.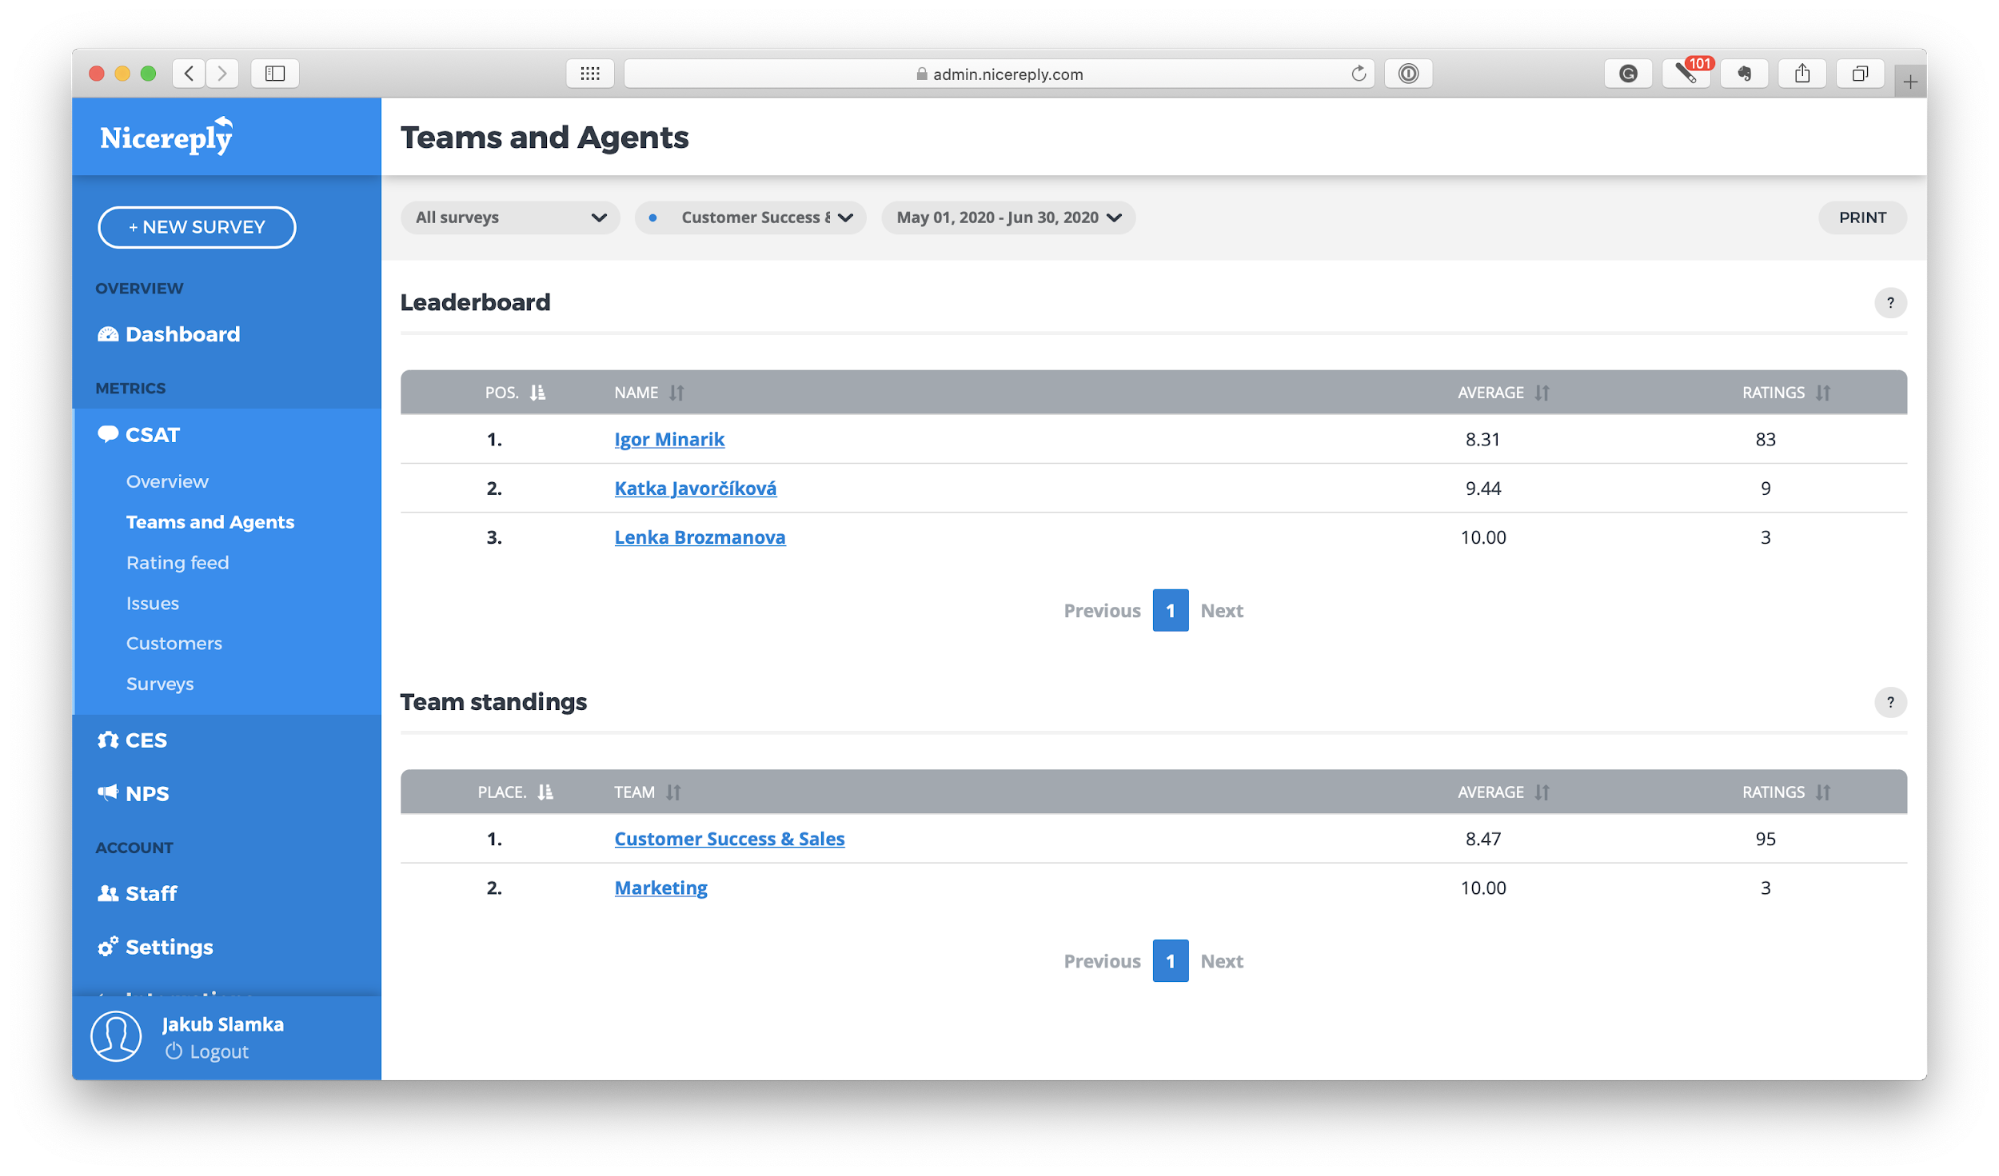
Apart from that you can also see average satisfaction levels of your customers, and all negative feedback listed together to be addressed.
In terms of reporting you can also set notifications, to receive email as soon as new feedback arrives, or export your data to a *.CSV file for further analysis.
The good
First of all you don’t have to use 3 separate tools to get a complete view of your customer satisfaction. Using a 3rd party solution (Nicereply in this case) allows you to view CSAT of your entire company, of different teams, agents and even customers.
You can also easily understand the context behind each individual feedback thanks to a ticket link.
Lastly, Nicereply also pushes CSAT rating and comment back to the Zendesk ticket as a custom value and a note, so you can see the basic data about a ticket without even leaving your Zendesk Support. You can also set automations in Zendesk, based on the value of the CSAT rating (for example, reopen the ticket if it receives a rating of 3 or lower).
The bad
Even though it’s just one extra app and not three, it’s still a new tool that will require time to set up and train your staff.
There’s also extra costs associated with running a 3rd party CSAT tool.
Viewing CSAT using Nicereply Zendesk widget
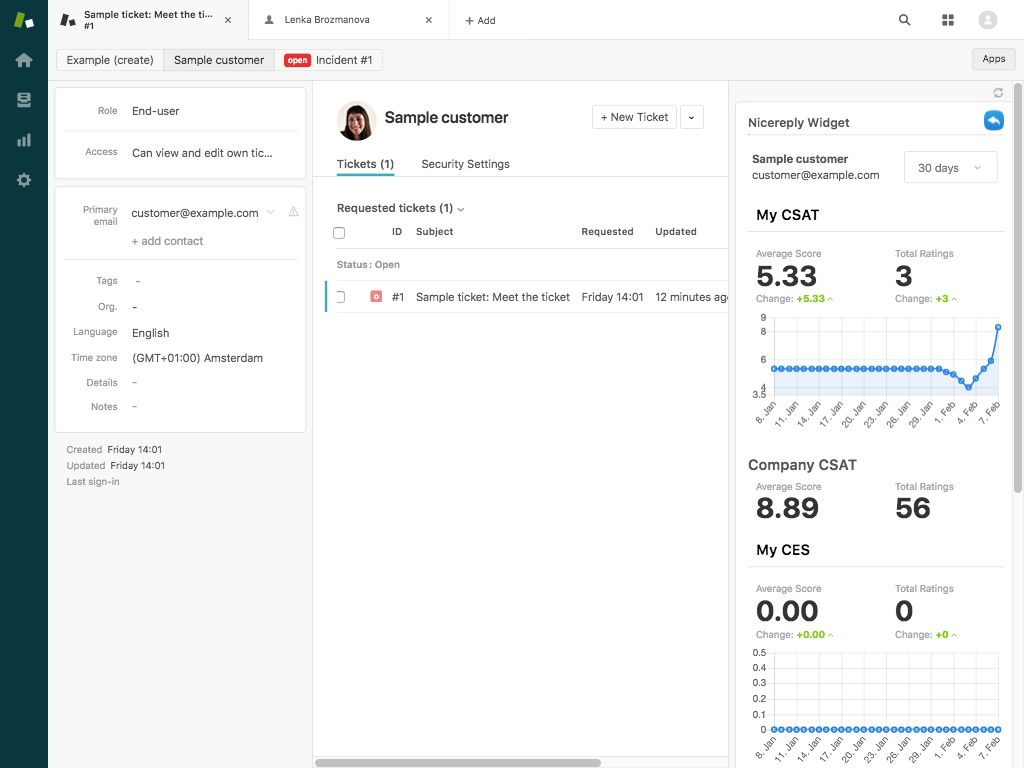
Nicereply’s Zendesk integration also comes with a nifty little tool called Zendesk widget. This widget allows you to see your data directly in your Zendesk account. After installing Nicereply widget you will see company ratings, dashboards, total number of ratings and average scores directly in Zendesk. The ratings will be also sorted by specific agent, customer, ticket, or you can see ratings for the whole company.
The good
The great thing is you’re getting access to a very clean dashboard of the most important data related to your customer satisfaction. The best thing is you don’t have to leave your Zendesk Support to view it.
The bad
Apart from the downsides of using a 3rd party tool covered above, there are no additional downsides. Nicereply widget doesn’t incur any extra costs and is very easy to set up.
Don’t lose sight of your north star
No matter which way (or a combination) of viewing your CSAT data you choose, make sure it stays visible for you and your team. They call it a north star metric for a reason, and if CSAT is indeed your north star, it should never stray too far from sight…
How did you like this blog?