So you’ve done the hard work of gathering customer feedback. You’ve created the perfect survey with a reliable distribution method, and as a result, have a gold mine of customer input at your disposal. Now it’s time to put that data to use with some customer feedback analysis.
No matter how well-executed the survey, you won’t get much use out of your feedback if you don’t analyze the results.
With the right survey design methodology and tools for data interpretation, you’ll be able to surface key insights from your survey results, and help your organization thrive.
In this post, we’ll walk through all the basics of customer feedback analysis, from prepping your customer data to using survey analytics tools to simplify the process.
What is customer feedback analysis?
The process of customer feedback analysis gives invaluable information to business owners when it comes to pinpointing the needs and frustrations of their customers. Companies use this data from various feedback reporting sources to enhance user experience and reduce customer churn.
How to conduct customer feedback analysis
Conducting survey analytics can be complicated. However, with a well-designed survey and a reliable reporting and analytics tool, anyone can quickly extract valuable insights from their customer feedback.
First things first — let’s make sure your customer data sets are in order.
Setting up the operational customer data
When you first designed your customer survey, you should have had an idea of who the people answering the survey would be, and how they interacted with your company. This customer data is the internal operational data that you want to associate with each respective customer’s feedback (experiential data).
Some common examples of operational data are: customer lifetime value, new versus existing customer, subscription duration, location, customer journey touchpoint, product purchased, service used, service agent, and user role. Even if your survey is an anonymous web survey, you can use the information you have, such as when and where the survey was delivered during the web experience, to segment the resulting data.
Connecting this operational data to the experiential data is the key to making the most out of your customer feedback and drawing meaningful conclusions.
Categorizing the experiential customer data
Customer feedback comes in two data forms: qualitative and quantitative. Quantitative metrics are represented by ratings your customers have given you, and qualitative feedback can be seen as free-form comments where customers explain the reasoning for their ratings.
Here are the fundamental steps to categorizing raw customer feedback so you can join it with your operational data.
- Read the open-ended feedback. You don’t want to miss an opportunity for a breakthrough idea, or a chance to improve an existing feature/service.
- After reading over the feedback, sort comments into categories based on meaningful keywords mentioned, such as hours, location, customer service, product features, etc.
- Filter the comments within these categories into positive and negative groups based on the qualitative score.
- Note trends that surface based on your keyword and sentiment filters. This is where an analytics dashboard comes in handy for lifting out significant feedback.
- Compare the feedback across segments using your customer operational data, sentiment scores, and surfaced trends.
At first, you may need to do some manual analysis to get a feel for where your strengths and weaknesses are, and to understand what keywords your customers use to describe them.
If you have a customer feedback platform with survey analytics tools, you’ll be able to set up filters using those keywords so all your future feedback will be automatically segmented for quick dashboard reporting and analysis.
In addition to organizing your customer feedback by score and feedback channel, well-designed customer feedback platforms allow you to pass operational customer data into the platform easily, or integrate customer data into your existing toolsets.
Equipping your team with the best customer data reporting and analytics software available greatly simplifies the survey analysis process, so that your customer experience program scales with you as your business grows.
In the next section, we’ll examine all of the need-to-know components of customer feedback analytics and how they work, so that by the end of this post you’ll feel prepared to derive valuable insights from your surveys.
Extracting relevant insights from customer data
Data without insights is virtually useless; if you don’t know how to interpret your customers’ feedback, you can’t use it to your advantage. On the other hand, with the proper tools and knowledge, customer feedback can be a real game-changer for your organization.
According to the White House Office of Consumer Affairs, loyal customers can be worth 10 times as much as a single purchase. Clearly, maintaining a positive relationship with your customers is in your organization’s best interest.
Properly interpreting customer feedback allows you to track customer sentiment over time, identify areas of weakness within your organization, and generate plans for future improvement. Dashboards are a great place to start.
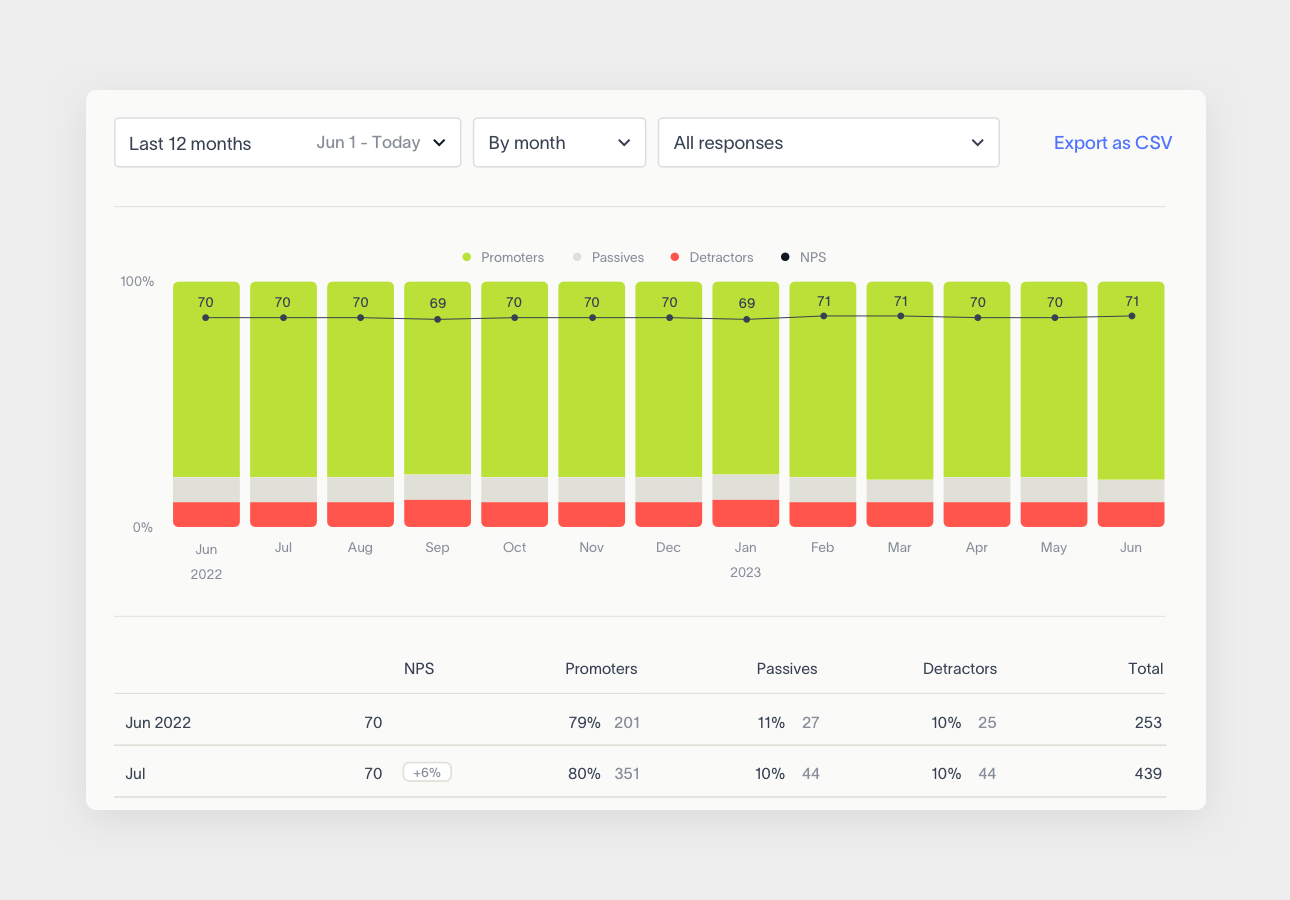
Feedback dashboard analytics
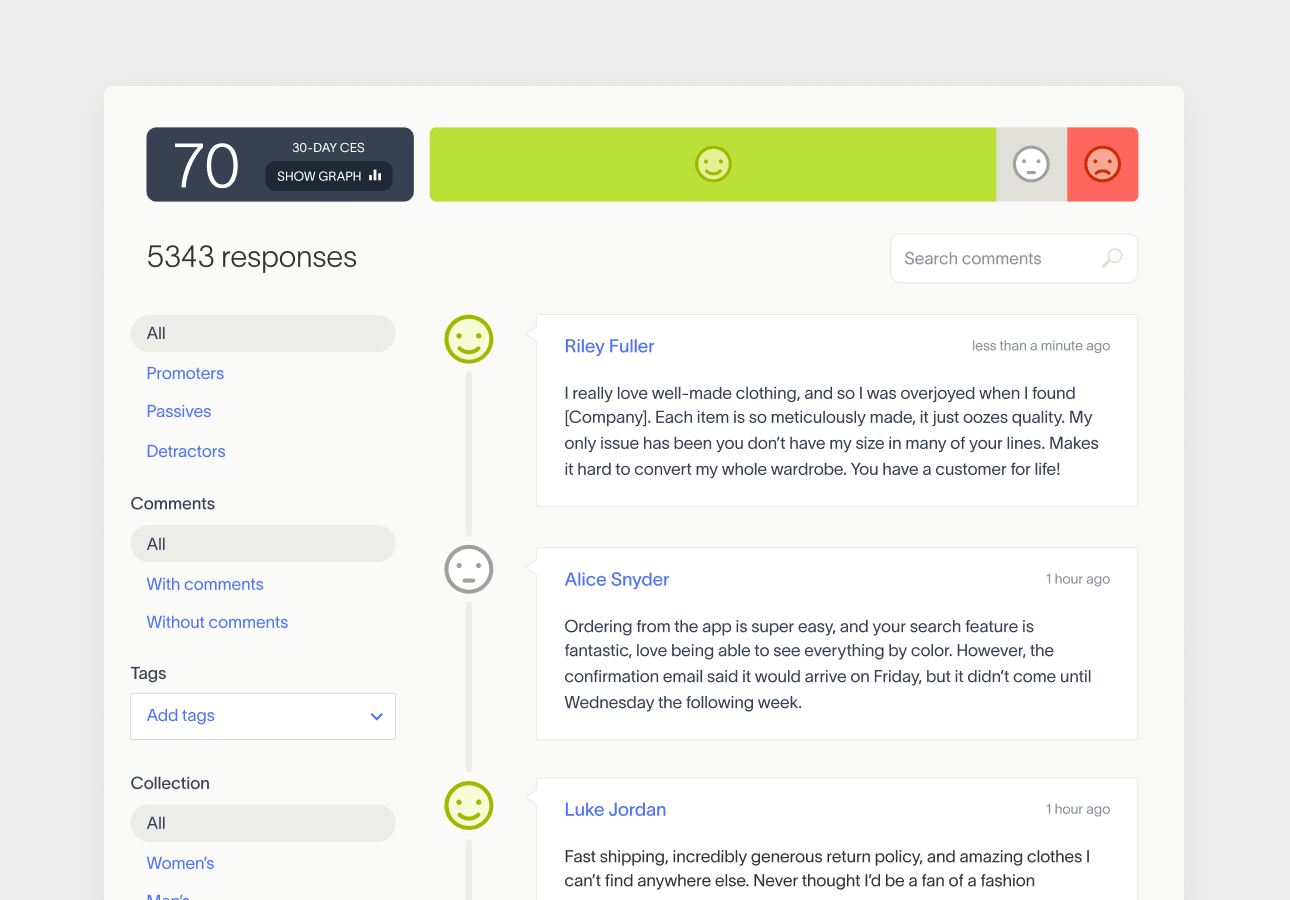
One feature that will make life easier is an analytics dashboard. The raw data from customer feedback can be disorganized and overwhelming. A customer feedback dashboard, however, is a streamlined way of organizing and visualizing customer feedback.
Using a customer feedback dashboard, you can easily track feedback in real-time and perform keyword searches to target specific areas of customer concern.
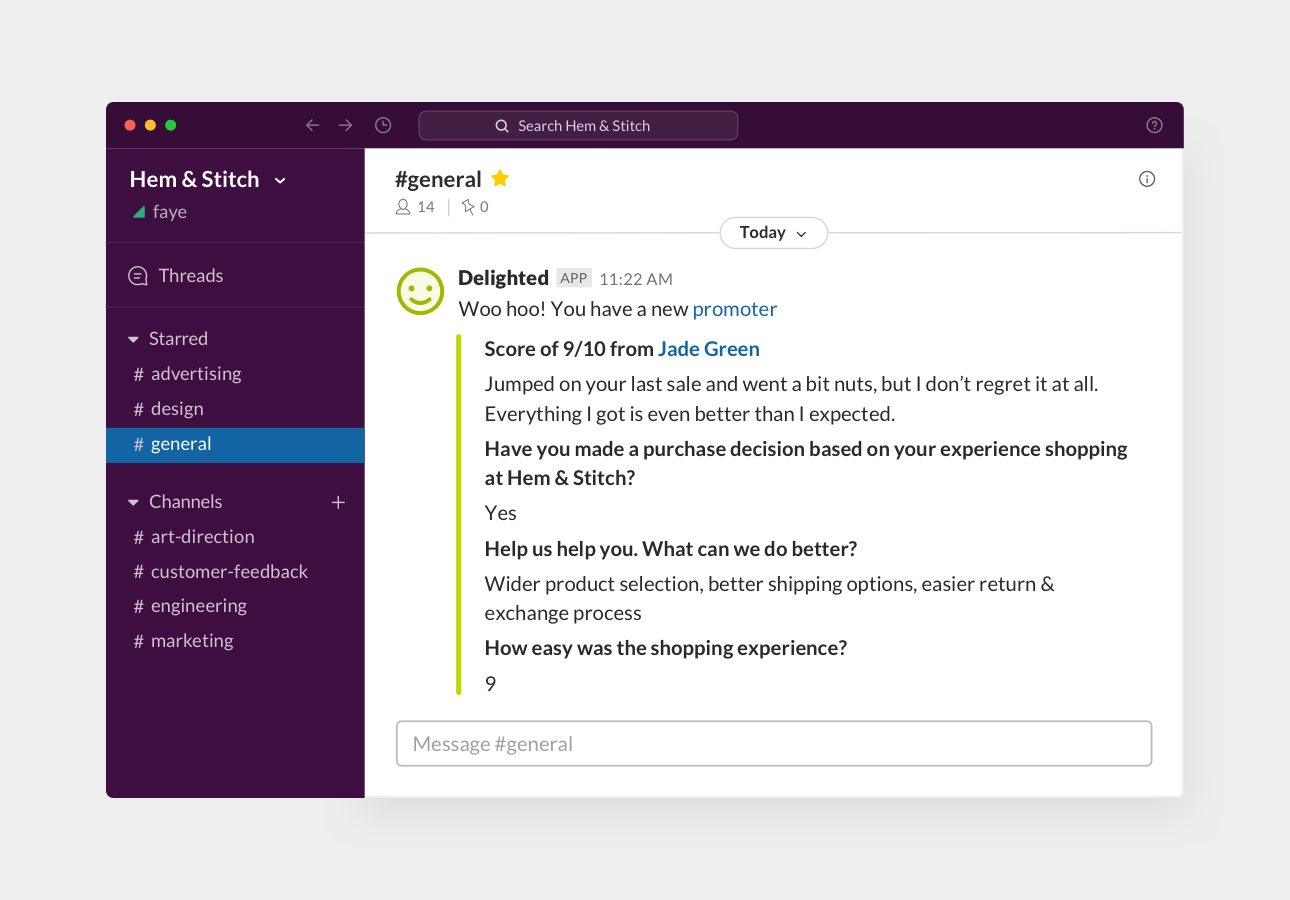
Customer feedback dashboards enable you to recognize and integrate insights gained from survey results to benefit your organization. The best dashboard tools also seamlessly integrate with your favorite platforms and services (like Slack or MailChimp), so acting off of feedback is easier than ever.
Having a firm grasp of customer sentiment can be make or break when it comes to increasing your organization’s revenue and productivity. According to Ruby Newell-Legner’s “Understanding Customers,” it costs 6 times more to attract a new customer than it does to keep an old one. Customer feedback dashboards equip you with the tools you will need to maintain customer loyalty.
Using a customer feedback dashboard, your organization can:
- Understand customer sentiment at a glance
- Filter feedback on keywords and customer segments
- Keep up with customer feedback in real-time
What’s more, a customer feedback dashboard gives all teams within your organization access to important customer data. That way all teams are on the same page, staying connected to real customer concerns.
Just ask JT Marino and Daehee Park, co-founders of the mattress company Tuft & Needle, how using a customer feedback dashboard has benefited their business.
Prior to implementing a customer feedback dashboard, Marino says “We weren’t hearing from people who were happy. We weren’t making the good things better.” That soon changed when Marino and Park decided to give a customer experience program a try.
Through the use of a powerful customer feedback dashboard, Marino and Park were able to determine that many of their customers were opening their mattresses in their living rooms as opposed to their bedrooms.
This exposed a design flaw in their mattresses: weak handles. With this new knowledge, Marino and Park were able to improve the design of their products to better suit their customers’ habits and increase customer satisfaction.
With a customer feedback dashboard, your organization will be capable of hearing the voices of the people who matter most: the customers.
Survey results analysis and reporting
Though data analysis and data reporting are two separate processes, in tandem they can provide actionable insights that significantly benefit your organization. But first, let’s go over some basics.
Data reporting is simply the process of tracking certain metrics within your organization (ex: number of sales and returns).
Survey data reporting goes one step further, and includes sharing the results and insights from your customer feedback surveys with the rest of the company. In order to arrive at those insights, the feedback data must be analyzed in the context of your internal business metrics.
The right customer experience management software makes data reporting and analytics easy, allowing you to recognize and track meaningful feedback trends within your body of customers.
Survey reports
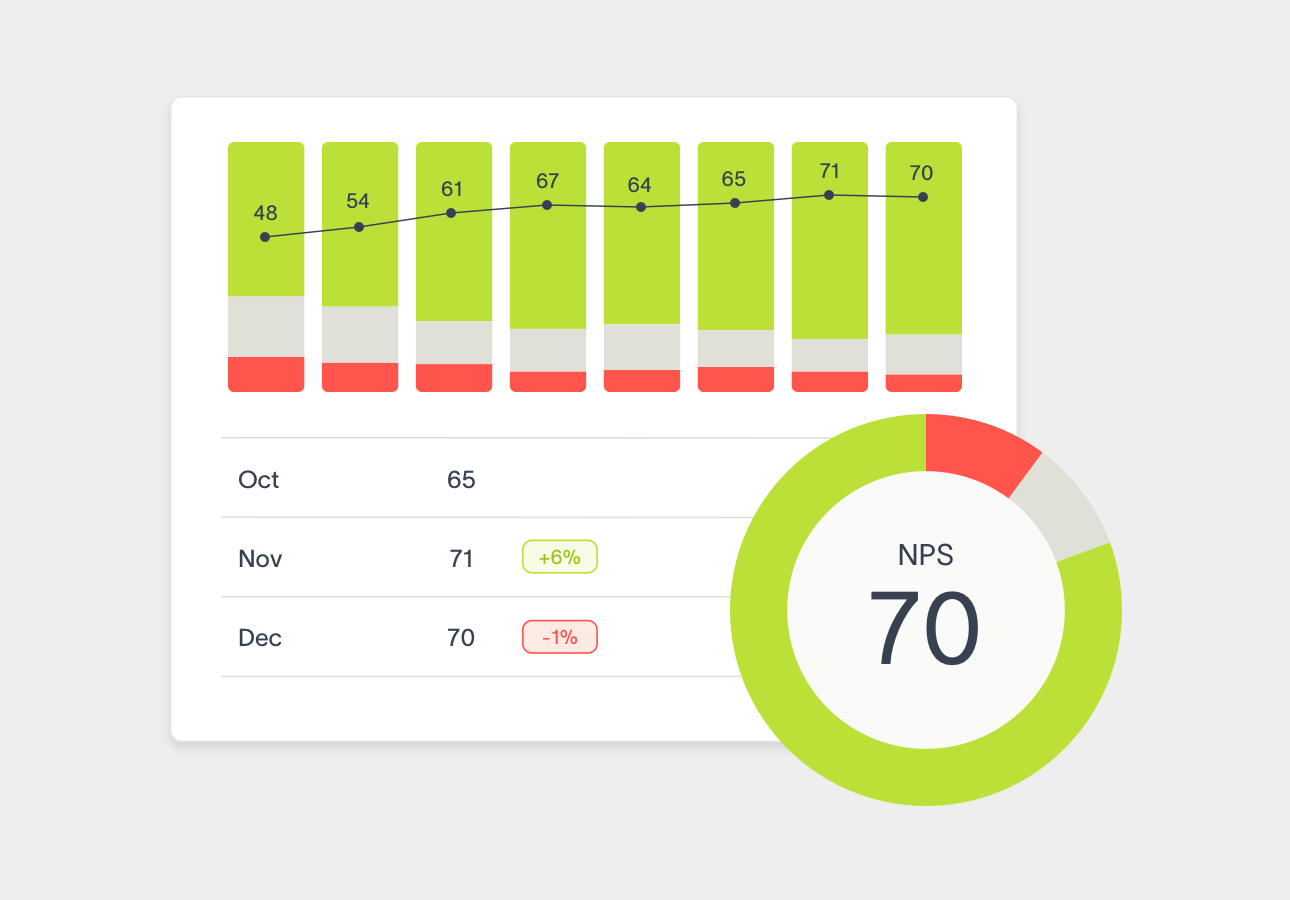
Survey reports are all about rolling up your customer feedback data into an easily understood, shareable format. Reports are used to benchmark and track your overall customer sentiment over time to ensure that you maintain a high standard of customer satisfaction.
Many customer experience programs provide user-friendly visual aids, making it easy to share reports of customer sentiment on a monthly, quarterly, and yearly basis. If your operational data has been piped in, you’ll also be able to segment customer sentiment by product line, customer type, and purchase channel.
These reports allow you to identify the top themes that create unsatisfied customers. This can then guide your organization in its plans for future improvement.
Staying up to date on current customer feedback is just as important as tracking trends. With real-time customer feedback reporting, you can ensure that your organization is keeping up with its customers on a daily basis.
Survey results analysis
When you’re running a customer service team or managing the customer experience across multiple channels, your deepest insights may come from comparing the performance of one customer service agent to another, or comparing the customer experience for different retail experiences.
When you create this comparison table, technically known as a contingency table, to compare user survey results across operational data (product lines, business units, and customer segments, etc.), you’re performing what is called a “cross-tab analysis.” Cross-tab analysis summarizes all of your categorized customer data in a dynamic table, so you can look at different experiences side by side for deeper insights.
However, formatting your data to do this analysis can sometimes be tricky, especially if you’re doing it all in an Excel spreadsheet. Using a dedicated tool can save you hours of time on a weekly basis.
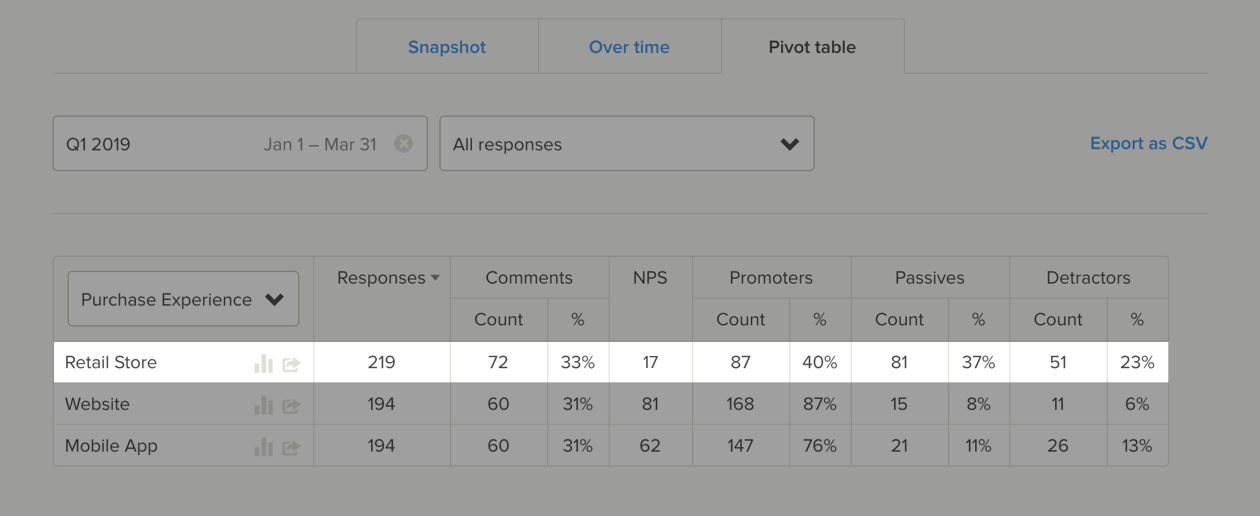
Let’s take a look at what a cross-tab analysis can help you uncover using the sample demo feedback above.
In this scenario, the in-person retail store experience is suffering. But what’s interesting is that when you compare channels side by side, you can see that the website and mobile app experience are faring significantly better.
After identifying this anomaly, dig into the open-feedback comments for more context to perform a root cause analysis. Compare what type of interactions are taking place in-store versus digitally, if there is a customer segment in particular that is having a bad experience, and get to the source of the negative reviews.
If you have multiple store locations and product collections, you could also pivot the customer data along those segments. Layering in other operational data, such as existing versus new customers and customer lifetime value can also result in interesting insights.
You can try pivoting this data yourself in the Delighted demo account.
Having a handle on the benefits of data reporting and analytics is critical. But, it’s also important to be intentional about how you source your customer data.
Next, we will discuss how different types of customer surveys can enable you to extract the kinds of customer feedback you need.
Insights based on survey type
As you may have suspected, different types of customer surveys yield different types of results. The type of survey you choose, then, should be reflective of the insights your organization aims to gain.
Below, we’ll walk you through three types of customer surveys that yield actionable results.
Net Promoter Score (NPS) surveys
NPS surveys measure customer satisfaction and loyalty. These surveys pose one question: How likely are you to recommend this product or service to a friend or colleague? (On a scale of 1-10). Following this question, customers can choose to engage in a freeform follow-up where they can further explain their rating.
In an NPS survey, those who answer 9-10 are considered Promoters, while those who answer 1-6 are considered Detractors. Anyone who responds with a 7-8 is considered a Passive.
Implementing NPS software does not only provide a general sense of how your product or service is doing. It also gives you an opportunity to target detractors in hopes of improving their customer experience.
Customer Satisfaction (CSAT) surveys
CSAT surveys are used to measure a customer’s satisfaction with a specific situation in our customer satisfaction survey software. These surveys ask: How satisfied were you with (product or situation)? Customers choose a response between 1-5 with the option of a freeform follow-up. Respondents who choose 4 or 5 are considered satisfied.
CSAT surveys are a great way of gaining insight into specific customer experience interactions. For example, after a customer support conversation or after a visit to a retail store.
Customer Effort Score (CES) surveys
CES surveys measure the amount of effort it takes for a customer to complete a certain action. For example, a CES survey might pose a statement like, “Microsoft made it easy for me to resolve my issue today,” and ask you how strongly you agree (between 1-5).
CES surveys are more important now than ever as customers expect products and services to be delivered with little customer effort.
As stated above, each type of customer feedback survey has its own purpose. Using a well-rounded experience management software platform enables you to choose between these major types of customer feedback surveys so that you can tailor your customer experience program to suit your organization’s specific needs.
Conclusion
When you take the time to read, sort and analyze feedback using the processes noted above, your customer surveying efforts will result in actionable insights.
Customer feedback dashboards make feedback easily accessible, and can be customized to your organization’s needs. With proper data reporting and analytics, you can easily track specific themes and trends in customer feedback, allowing those metrics to inform future decisions.
Ultimately, by using a customer experience program, you are ensuring that your customers are being heard.
Now that you’ve got a better grasp of the basics, it’s time to choose a customer experience program that works for you and, more importantly, your customers.
Try gathering and analyzing feedback for free with Delighted.