
The following is an edited excerpt from Listen Or Die by Sean McDade, PhD.
The true “voice” of your customer is the unique words they share with you each time you ask them “Why” or “Please tell me more about that” in your survey.
There is gold in each comment that customers share with you. The question is this: how do you best mine for that gold? Enter text analytics.
But first, a quick overview of structured vs. unstructured feedback:
Structured vs. Unstructured Feedback
No matter how you are listening to customers, the data you will ultimately collect will be one of two types: structured or unstructured.
Structured Feedback
Structured customer feedback is the most common, and the easiest to deal with. For example, a typical question in your survey might be, “How satisfied were you with your most recent experience at Hotel ABC on a scale of 1 to 5, with 5 being very satisfied and 1 being very dissatisfied?”
When customers provide their answer to this question, it comes in the form of a number. In this case, a 5 would indicate very satisfied with the most recent visit to the hotel, a 1 would indicate very dissatisfied, and so on.
Almost any VoC software platform can easily analyze these data and create graphs to aggregate and compare the responses: Maybe 30% of respondents were very satisfied, 35% very dissatisfied, and so forth.
Unstructured Feedback
The next question in the survey might be “Please tell us why you feel that way.” This is prompting the customer to type in open-ended, or unstructured, comments to explain their level of satisfaction with the experience. A customer might type in something like “The front desk took too long to check in,” “The room was dirty,” or “The people staying in the room next to me were loud and I didn’t get any sleep.”
Unlike structured data, which are easy to display graphically or in tables, each piece of unstructured data is different—unique to each customer who took the time to provide it.
This unstructured customer feedback is key to understanding why satisfaction levels are what they are, but is much more difficult to understand at scale.
Making Sense of Unstructured Feedback
How do we make sense out of unstructured comments from customers? There are two options: humans or machines.
Humans (Open-Ended Coding)
Humans are the most expensive method to make sense of unstructured comments—often prohibitively so, because not only are they expensive knowledge workers, but the effort also doesn’t scale.
An approach to unstructured data analysis made popular with market researchers is called open-ended coding. Here’s how it works:
A person is tasked with reviewing a small sample (one hundred is common) of open-ended customer comments and the goal is to identify major “themes” from these comments. They create what is called a “codebook” that contains a handful of major themes (usually five to ten). Then usually another person reviews the remainder of the open ends, one by one, and assigns one of the major themes to each comment. We are talking about thousands of comments, which in some circumstances means days or weeks of work. The end result is that unstructured comments become structured!
Market researchers then create a report that quantifies these comments—such as 43% of people mentioned Wi-Fi as a problem, 16% mentioned the spa as an issue, and so on.
The human approach is virtually impossible to scale. For PeopleMetrics’ larger clients, we send out more than 20,000 surveys a week, which results in thousands of open-ended responses. In a given day, even the best human coders might only be able to handle a few hundred comments.
Machines (Text Analytics)
Machines, on the other hand, can scale infinitely.
All sophisticated VoC software platforms will have a text analytics module available. Using a computer algorithm that identifies common themes or topics by scanning and grouping customer comments, text analytics provides an unprecedented ability to make sense of and take action on large volumes of unstructured customer feedback. Here’s how it works:
“Wi-Fi” could be a topic, but some customers might call it “wireless internet.” Others might say only “internet” or “speed of internet” or “web access.” After a little training by a human, the machine quickly learns to identify all those terms as “Wi-Fi.”
Next, the machine is trained to understand customer sentiment for each comment. One customer might say, “I love this hotel because the wifi is so fast.” Another customer’s comment could be, “wifi, there was nothing fast about it, so frustrating.” The machine then assigns a sentiment score for each comment related to given topics, usually ranging from –1 to +1.
Text analytics then organizes all topics into a visual display, often in the form of a word cloud. If you’ve seen one, you already know that the size of each word reflects how often the topic is mentioned. Its color indicates the sentiment: red usually indicates negative, green for positive, and yellow for neutral. Here is an example of a text analytics word cloud from a telecommunications company:
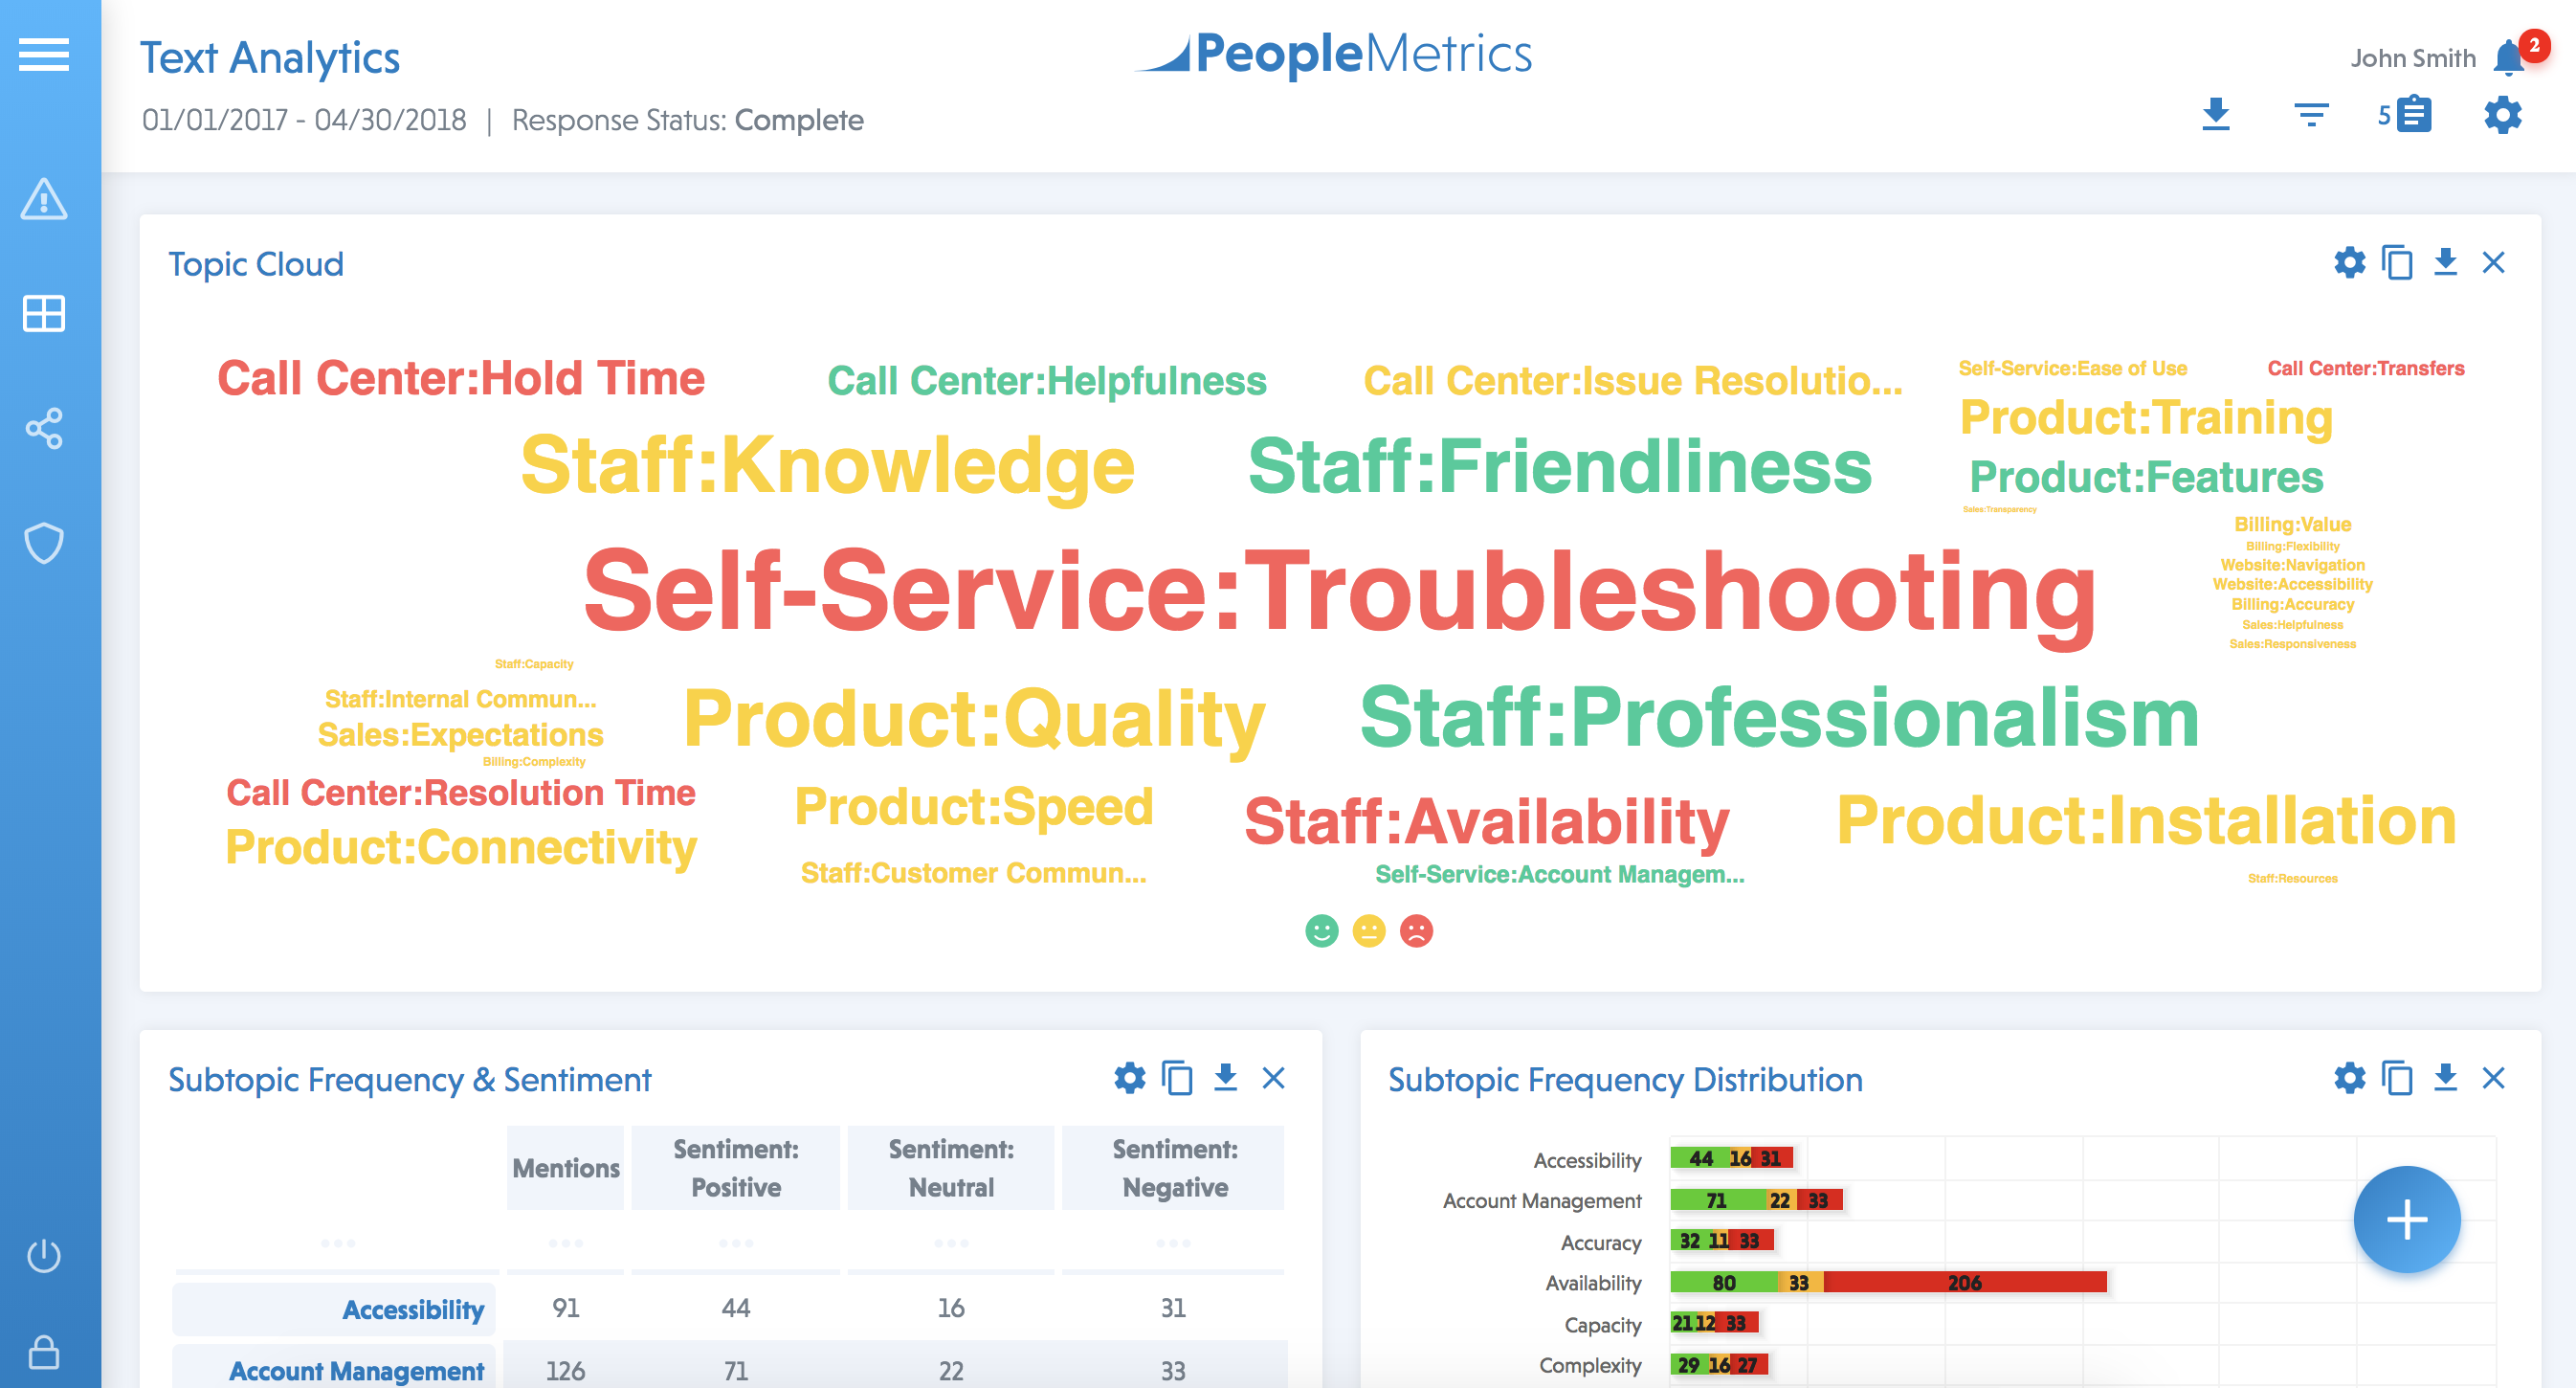
Text Analytics in the PeopleMetrics Customer Experience Management (CEM) Platform
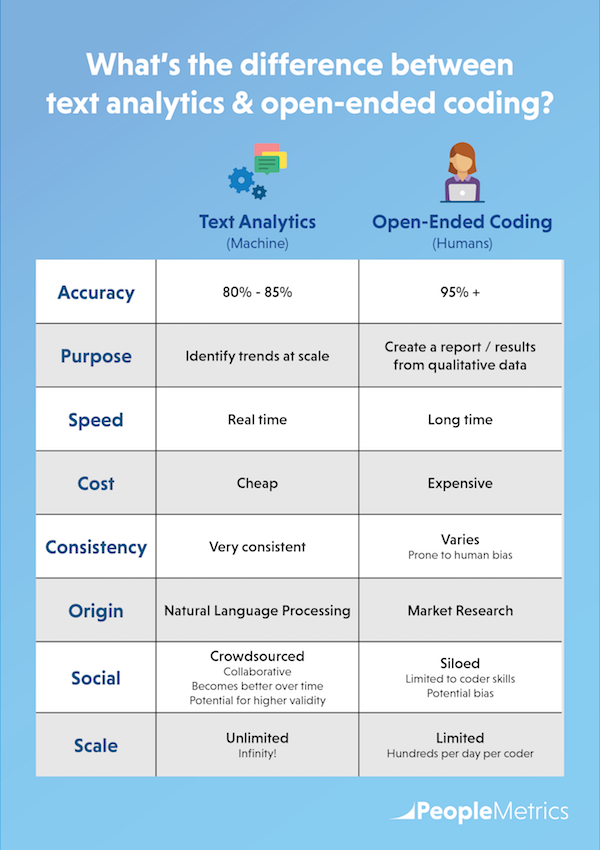
Speed, Accuracy & Cost
Human coders can’t even begin to compete with text analytics in speed and cost. Although it costs more up front to set up text analytics—maybe $10,000 to $20,000—the cost per comment when it’s up and running is minimal. Costs will not continue to build with volume, while you might pay humans a dollar or two per comment indefinitely.
While text analytics can’t match the accuracy of human coders (at least right now)— as high as 95% accurate for humans, compared with 80% to 85% for text analytics—with volume and time, text analytics learn. When people spot contradictions and correct them, they are training the machine to do better the next time.
Human coders, on the other hand, are more likely to become less accurate with higher volume and time, skimming long comments for words they’re used to seeing instead of looking for anything new. In contrast, the machine, which neither bores nor tires, can identify both familiar words and emerging outliers.
If you’re still concerned about the difference in accuracy between open-ended coding and text analytics, let it go! Consider the trade-off between greater accuracy on every comment and the ability to spot key trends in real time that will help you improve CX.
Final Word
If you don’t have a quick, accurate, and affordable way to process your unstructured customer feedback, collecting it in the first place is a pointless exercise. Text analytics represents the present and future. Without it, you are not getting all you can out of your VoC program.
Response rates are dropping for longer surveys, and you need to get more out of fewer open-ended questions. Plus, with the continuing growth of social media, you can expect to receive more unstructured feedback in the form of social reviews. This is why I’m saying that text analytics is not a feature of VoC; it is VoC. It’s the only way you can stay on top of key trends in a cost-efficient manner at scale.
Click here to download the book.
Sean McDade, PhD is the author of Listen or Die: 40 Lessons That Turn Customer Feedback Into Gold. He founded PeopleMetrics in 2001 and is the architect of the company’s customer experience management (CEM) software platform. As CEO, he guides the company’s vision and strategy. Sean has over 20 years of experience helping companies measure and improve the customer experience. Earlier in his career, he spent five years at the Gallup Organization, where he was the practice leader of their consulting division. His company offers CEM software with advanced machine learning solutions and hands-on analytical support to help companies make sense of their CX data. Sean holds a Ph.D. in Business Administration with a specialization in marketing science from Temple University in Philadelphia. He has published eight articles in peer-reviewed scholarly journals and has taught over 25 marketing classes. Sean was named a 40 under 40 award recipient of the Philadelphia region. He is an active Angel Investor, including investments in Tender Greens, CloudMine and Sidecar.
P.S. What did you think of this blog post?
 |
 |
 |